Month: March 2025

  • India, Pakistan, and the State of Religious Harmony

    India, Pakistan, and the State of Religious Harmony

    This text comprises an interview exploring complex socio-political issues in India and Pakistan. Key themes include religious harmony between Hindus and Muslims, the impact of historical events like the demolition of the Babri Masjid and the revocation of Article 370, economic disparities, and the role of political leadership. The discussion also touches upon the legacies of Gandhi and Jinnah, examining their influence on the partition and subsequent tensions. Finally, the interview concludes by emphasizing the importance of humanity above religious or political affiliations.

    Analyzing Indian Society: A Critical Perspective

    Instructions: Answer each question in 2-3 sentences.

    1. What is the speaker’s perspective on the role of the government and administration in addressing wrongdoing, particularly in the context of communal issues?
    2. How does the speaker connect economic policies and population to the relative success of India compared to Pakistan?
    3. What are the speaker’s arguments concerning Article 370 and its removal?
    4. How does the speaker describe the legacy of Mahatma Gandhi and Nathuram Godse?
    5. What is the speaker’s view on the Uniform Civil Code and why does he suggest caution in its implementation?
    6. How does the speaker understand the relationship between justice, caste and religion?
    7. What is the speaker’s perspective on the comparisons between Rabindranath Tagore and Allama Iqbal?
    8. How does the speaker describe the current political climate and the alleged influence of the Modi government?
    9. What does the speaker mean when they say that “humanity” should come before religious identity?
    10. What is the overall message or plea the speaker tries to communicate at the conclusion of the interview/discussion?

    Quiz Answer Key

    1. The speaker believes that the government and administration should be the first to arrest those doing wrong in communal issues, and that weakness or lack of admission from those in power will only perpetuate negative actions. The speaker also asserts that the administration’s actions will define a state.
    2. The speaker argues that India’s large population has created a large market, which has led to more economic opportunities for the country, unlike Pakistan which has suffered a monopoly from its increased population.
    3. The speaker does not support the removal of Article 370, citing that it recognized Kashmir’s unique demographics, and that its removal has ignored the rights of the people in Kashmir, leading to protest.
    4. The speaker admires both Gandhi and Mahasahab, but finds that Gandhi’s lack of love for “Uday” and his desire to go to Pakistan, angered extremists like Godse, who the speaker links to the RSS.
    5. The speaker suggests that the government should not rush the implementation of the Uniform Civil Code, as the code should be a collective discussion between the government, religious leaders, and the people to ensure fairness for all groups.
    6. The speaker believes that justice should come before caste, religion or other group identities. He suggests that while people often believe that religious leaders have the answers, justice is for everyone.
    7. The speaker does not think that comparisons between Tagore and Iqbal are appropriate. He believes both made valuable contributions in their respective fields and that people prefer the authors they grew up with.
    8. The speaker feels the current political climate under the Modi government has ruined India’s pride by injecting religious division into society. They allege that Modi prioritizes Hindu happiness at the expense of Muslims.
    9. The speaker asserts that humanity is the highest ideal and that religious or any other identity should not come before it. They call for unity, and a focus on how humans should be treating each other.
    10. The speaker concludes by emphasizing the need for love, unity, and humanity over religious division, and asks that people stop following misleading or divisive narratives.

    Essay Questions

    Instructions: Write an essay of approximately 500 words for each prompt.

    1. Analyze the speaker’s critique of the Indian government and administration. How do specific examples they use relate to their overall arguments about justice, equality, and governance?
    2. Discuss the speaker’s understanding of the relationship between religious identity, nationalism, and political power. How does the speaker’s personal perspective inform their interpretation of current events?
    3. Evaluate the speaker’s perspective on the Uniform Civil Code. How does their view on this law connect to their broader concerns about religious diversity and equality in India?
    4. Compare and contrast the speaker’s interpretation of Gandhi and Godse. What do these contrasting figures represent within the broader context of Indian history and identity?
    5. How does the speaker’s use of economic concepts, like market growth and supply chain issues, support their more general political and social commentary? How does this use of economics connect to the other themes discussed in the source?

    Glossary of Key Terms

    Article 370: A special provision in the Indian constitution that granted special autonomous status to the state of Jammu and Kashmir. It was revoked by the Indian government in 2019.

    Babri Masjid: A mosque in Ayodhya that was demolished in 1992, which led to widespread communal violence between Hindus and Muslims.

    Communalism: A concept denoting loyalty to one’s own community or ethnic group rather than to the broader society or nation, often used in the context of religious or cultural divisions, particularly within South Asia.

    Indian National Congress: A major political party in India that played a key role in the country’s independence movement.

    Mahasahab: Refers to a respected elder or leader, used to denote the importance of a figure.

    Mohammed Ghazali: A Turkic conqueror who led several invasions of India during the early 11th century.

    Mughals: The dynasty that ruled much of India from the early 16th century to the mid-18th century, known for its contributions to art, architecture, and culture.

    Nathuram Godse: The assassin of Mahatma Gandhi, motivated by opposition to Gandhi’s policies and views, as well as his perceived bias towards Muslims.

    Rashtriya Swayamsevak Sangh (RSS): A Hindu nationalist organization established in 1925 that is viewed as a far-right Hindu nationalist group. It is often seen as the source of the ideology that assassinated Gandhi.

    Taliban: A fundamentalist Islamic organization, currently the de facto government of Afghanistan.

    Uniform Civil Code (UCC): A proposal to have a single set of laws governing personal matters such as marriage, divorce, and inheritance for all citizens, regardless of their religion.

    Vishwa Hindu Parishad (VHP): A Hindu nationalist organization known for its activism and involvement in various religious and social issues.

    India’s Unrest: A Critical Dialogue

    Okay, here’s a detailed briefing document summarizing the main themes and ideas from the provided text.

    Briefing Document: Analysis of “Pasted Text” Excerpts

    Overall Theme: The text presents a wide-ranging, somewhat disjointed, but passionate discussion of various issues impacting India, particularly focusing on social, economic, political, and religious tensions. The speaker(s) express concerns about justice, equality, and the direction the country is heading. It appears to be an interview or a dialogue with multiple participants, giving rise to conversational flow.

    Key Themes and Ideas:

    1. Religious Tensions & Hindu-Muslim Relations:
    • Allegations of Targeting Muslims: The text opens with a question about Indian Muslims being “the missile of Muslims,” implying a perceived threat or negative stereotype. The speaker refutes this, emphasizing the diversity within the Muslim community.
    • Blame for Discord: The discussion implicates not just the government, but also community leaders and society at large in the creation of disharmony. “Everyone is there, there is the government, there is the administration and there are also those people who are leaders of the community.”
    • Historical Grievances: The Babri Masjid demolition is referenced as a point of contention, and the speaker suggests a need for objective historical analysis.
    • Concerns of Religious Nationalism: There’s a critique of the idea of creating a nation based on religion, suggesting this is a “matter of man and monkey, it should be between God.”
    • Interfaith Harmony: The text stresses the long history of Hindus and Muslims living together in India. However, it acknowledges recent increases in communal tension, particularly during the Holi festival season which has become more polarized.
    • “Hindus and Muslims have been living together in India for thousands of years, you will be surprised, that is not the masala, the masala is the one which has spoiled the atmosphere in the Holi season which is still far away.”
    • Critique of Political Manipulation of Religious Tensions: The speaker suggests the current government, particularly Modi, have injected “poison” into India, leading to polarization. They are particularly concerned that Modi makes Hindus feel happy but seemingly does not cater to the Muslim population.
    1. Critique of Governance and Administration:
    • Weak Administration: The speaker criticizes a perceived weakness in administration, noting how wrongdoing is not always addressed. “If the administration is a state, then it will immediately first arrest those who are doing wrong and if the administration is weak and does not want admission then it leaves them.”
    • Economic Injustice & Inequality: The text highlights the unequal distribution of wealth in India, stating it mostly reaches those already privileged. It states “wealth distribution in India is still not equal, it has come to those people Those who are already good in the eyes of the government.”
    • Economic Disparities and Inflation: The speaker points out economic disparities by citing price differences between India and neighboring countries. The increased prices of essential goods in India is also criticized as a problem of ineffective administration. “The price here is up to ₹300 and up to ₹200 I reached there and asked both of my friends there that in Amritsar it was for ₹30 so the thing is that so much download, so good, you have got this on this only, if your administration is not right…”
    • Lack of Accountability: The speaker criticizes the system for not holding those who profit through corruption accountable, highlighting the need for active oversight. The speaker also stresses the need for immediate action when injustice is reported.
    1. Article 370 & Kashmir:
    • Critique of the Removal: The speaker expresses strong disagreement with the removal of Article 370, stating it was designed to protect the special status of Kashmir, where the majority population is Muslim. “Under Article 370, the people there were told that you are in India but your rights are different from those of common Indians.”
    • Rejection of Terrorism Link: The speaker questions the idea that terrorism in India was linked to Article 370 and calls for conversation as a solution.
    • Emphasis on Kashmiri Pride: The speaker suggests Indian Muslims should feel pride in Kashmir being a part of India and should want to be a part of that heritage.
    1. Historical Figures & Events:
    • Gandhi and Godse: The discussion delves into the assassination of Mahatma Gandhi, with the speaker highlighting that Gandhi was against the formation of Pakistan. They also stress that Gandhi was assassinated by a member of a party that is aligned with Modi’s government and that people who support Modi’s party also killed Gandhi. This is used to suggest a historical association with violence of the political ideology that Modi represents.
    • “I belonged to this party which is supported by Modi, whose Modi has also come and then you yourself say that you also tried to take Congress into the picture, I told you about that What did you say, Modi is from this party, we have come, a man of this party has killed Gandhi…”
    • Jinnah and Partition: The speaker defends Jinnah, arguing he was ready for the formation of Pakistan because there was no other viable leader in the region. This is also framed as a result of a lack of consensus by all parties in India’s transition.
    1. Social Issues:
    • Caste System: The speaker calls for a law to specifically address the discrimination and harm caused by caste. “The thing is that because of caste, a law should be made for heads because of the caste people.”
    • Uniform Civil Code: They raise concerns regarding a Uniform Civil Code, highlighting that it could infringe on the religious freedom of minority groups.
    • “Uniform Civil Code will be issued, the religious scholars here say that Muslims will again get trapped in this…I think that if we are Muslims, we are Hindus, we are Sikhs, we are Buddhists, some of our principles do not fit in the Uniform Civil Code…”
    1. Call for Justice and Equality:
    • Focus on Humanity: There is a strong emphasis on the importance of justice and human rights over religious differences, the speaker emphasizes: “There is nothing above humanity I have no religion, thank you”
    • Emphasis on Common Concerns: The speaker stresses the need to focus on the real problems of ordinary people, rather than being distracted by manufactured religious divisions.
    • Importance of Dialogue: The text ends on a positive note, with a call for continued debate and discussion for social reform, emphasizing that humanity must always come before religion.
    1. Literary and Intellectual Figures
    • Iqbal and Tagore: There is a discussion and comparision of Allama Iqbal and Rabindranath Tagore, two prominent literary figures. The speaker acknowledges that for people of the same language, one may be more loved than the other. There is a stated fondness for both authors and an argument against comparing them or stating one is more important than the other.
    • Javed Akhtar: There’s an opinion given that Javed Akhtar is a ‘thief’ and that the interviewer should have read the work of Javed Iqbal.

    Overall Tone: The tone is passionate, critical, and at times frustrated. The speaker expresses a strong desire for social justice, equality, and a more harmonious society. There’s a sense that India has been led astray by divisive politics and that the common person is suffering because of it.

    Conclusion: The text provides a complex and multi-faceted view of India’s current socio-political landscape. The speaker(s) are not afraid to criticize powerful institutions and figures and are clearly motivated by a deep desire for positive change. The conversation is rich in detail and offers a glimpse into the concerns of at least one segment of Indian society.

    India’s Fractured Soul: A Critical Analysis

    FAQ

    1. The speaker mentioned Indian Muslims being like a “missile.” What does this statement mean and who does the speaker hold accountable for this perception?

    The speaker uses the term “missile” to describe how Indian Muslims are sometimes perceived, implying they are seen as a dangerous or destabilizing force. He clarifies that he does not believe this to be true, rather this perception has arisen from failures across different sections of society. He places blame on multiple factors, not just one entity: the government and administration for failing to act impartially and enforce the law equally, community leaders for not addressing issues proactively, and even, in a complex way, how the actions of individuals are perceived, as he mentions that attacks from the past shouldn’t color how we see people today. He specifically mentions the government’s responsibility to act decisively against wrongdoing, regardless of the community, and for failing to address biases.

    2. What are the speaker’s views on the Babri Masjid demolition and its aftermath?

    The speaker references the Babri Masjid demolition in 1993 as an example of how historical events and their narratives are used to fuel division. He mentions that he himself wrote articles suggesting excavation to uncover the truth about its foundations. He criticizes those who immediately jump to conclusions based on religious identity. He also mentions how the Vishwa Hindu Parishad targets specific sites and communities. He suggests that creating nations on the basis of religion is a flawed premise and that faith should be a personal matter, not a source of societal division. He then points out this applies to other nations like Israel and their religious history.

    3. The speaker discusses the economic situation of India and Pakistan. What comparisons does he draw and what points does he make about government responsibility?

    The speaker compares India and Pakistan, focusing on their economic differences. He notes India’s rapid economic growth and status as the 5th largest power, while Pakistan is struggling. He suggests that India’s population has led to economic growth, especially in the technology sector. He attributes these differences to government policies and administration, citing issues of poor infrastructure, high prices of basic commodities like onions and tomatoes in India. He uses the example of price discrepancies to show how inefficiencies in the administration negatively affect the common citizen. He states that administrations have the responsibility of oversight and to act on complaints.

    4. The speaker expresses concern about rising tensions between Hindus and Muslims in India. What, in his opinion, has caused these divisions and how does he see the situation evolving?

    The speaker is deeply concerned about the rise in Hindu-Muslim tensions, which he sees as a departure from the historical peace and co-existence in India. He attributes the current atmosphere of division to the injection of “poison” by political elements, specifically referencing the current government (though he avoids mentioning any individual directly). He notes a trend where there is an effort by this government to appease Hindus while not doing so with Muslims, which he views as problematic. He laments that a “Hindu vs Muslim” mindset is becoming prevalent, even outside of real conflict or cause. He believes this has damaged the pride of India.

    5. What is the speaker’s perspective on Article 370 in Kashmir and its revocation?

    The speaker opposes the abrogation of Article 370, arguing that it was a special provision for Kashmir, a sensitive state with a Muslim majority. He believes that by stripping Kashmir of its special status, the Indian government is taking away their rights rather than integrating them with India. He also suggests the act of removing Article 370 is not in the interest of Indian unity, and that it may be a cause of the terrorism in the region. He notes that Article 370 did not hinder Kashmiris from living in India, going to school in Delhi, and having access to other parts of the country, as well as suggesting that the government didn’t communicate with them as well as they should have on the issue.

    6. The speaker discusses Gandhi and Godse in the conversation. What does he say about them and their significance?

    The speaker regards both Gandhi and Jinnah as leaders in their respective places and highlights their unique qualities. However, he discusses the circumstances surrounding Gandhi’s assassination. He notes that Gandhi’s assassination was the work of a “special party” with a right-wing ideology. He connects Godse’s actions to a larger movement that he claims is a product of the Rashtriya Swayamsevak Sangh, which he identifies as an extremist organization. He mentions that some people believed Gandhi favored Muslims and that Godse was a product of this sentiment. He also notes that there was a feeling that Jinnah had no choice but to form Pakistan, due to the circumstances. He feels that no one paid attention to his views and that Jinnah did nothing wrong, but that time was an element that caused the events to occur as they did.

    7. The speaker mentions the Uniform Civil Code. What is his opinion on the matter?

    The speaker expresses concern about the potential pitfalls of implementing a Uniform Civil Code without adequate consultation. He suggests that while he agrees people need to be equal in society, the government needs to consult with religious leaders from different communities to understand why certain groups might not be able to follow the Uniform Civil Code. He also makes the point that “religious freedom” does not mean people should follow these laws automatically. He emphasizes that rushing this decision is not good governance. He also makes the point that religious leaders are imperfect. He states that government officials need to approach this matter more thoughtfully, and suggests that this kind of behavior is what “misleads” people.

    8. The speaker talks about the importance of humanity. What does he emphasize when he talks about how people should behave?

    The speaker emphasizes the paramount importance of humanity over religious or political identities. He suggests people should be mindful of misleading information, and that people should trust their own hearts. He argues that the divisions are being fueled by misleading narratives and that people shouldn’t blindly follow these narratives. He also says he wants to see the end of the idea that Hindus and Muslims are at odds, especially in matters of day to day life. He calls for justice to be delivered with strict actions and says that this is why people are being misled. He states that people need to know there are more peace loving people than not, and that humanity is the most important thing, and above all religion. He claims he does not have a religion.

    India-Pakistan Relations: A Conversation

    Okay, here is a timeline and cast of characters based on the provided text:

    Timeline of Main Events/Topics Discussed

    • 1993: Babri Masjid demolition. This event is mentioned as a key point of conflict and is used to illustrate administrative weakness and bias. There was a supposed serial made about this. The speaker also wrote two articles at the time about the site needing excavation.
    • Past (unspecified): Mohammed Ghazali’s attacks on India. This is brought up to challenge the idea that aggression is solely a modern issue or uniquely tied to one religion.
    • Recent past (unspecified): The speaker mentions price gouging and lack of oversight on the sale of basic goods. They also refer to price differences between India and Pakistan, noting that prices in Pakistan can be lower.
    • Recent past (unspecified): Discussion of India becoming the 5th largest economy with a growing population. This is contrasted with Pakistan’s economic struggles.
    • Recent past (unspecified): Kashmiri people are discussed, as well as their educational migration, and the infrastructure of Kashmir. The financial burdens are mentioned, specifically the high cost of living.
    • Recent past (unspecified): Discussion of the removal of Article 370 from Kashmir.
    • Pre-Independence (unspecified, but likely early 20th century): Discussion of Mahatma Gandhi and his political positions and assassination. Nathuram Godse, the assassin, is placed within the context of the RSS.
    • Pre-Independence (unspecified, but likely mid-20th century): The speaker reflects on the creation of Pakistan, Jinnah’s role and how the political leaders of the time are viewed in retrospect.
    • Recent past (unspecified): Discussion of a Uniform Civil Code being considered in India.
    • Present: Discussion about how to properly interview and ask questions, and the necessity of not discriminating against anyone or their religion.
    • Present: Discussion of Allama Iqbal and Rabindranath Tagore, two well known writers.
    • Present: The speaker contrasts Indian and Pakistani people’s mindsets. They are hopeful that both sides can move past conflict and division.
    • Present: Discussion of an upcoming Holi festival and a hope that it will be peaceful.

    Cast of Characters

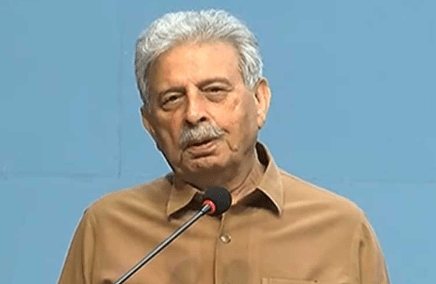
    1. Unnamed Speaker (Film Sahab): The primary voice in the provided text. They are opinionated, well-read, and speak on a variety of subjects, from religious conflict and history to economics and social justice. They seem to strive for equality and an end to religious and nationalistic strife.
    2. Afzal Sahab: A person who is labeled as a criminal and taken out in old times, referenced in connection to the Vishwa Hindu Parishad website. He is used as an example of biased media reporting and targeting. There is another reference to an Afzal Rehan, which might be the same person, but is unclear.
    3. Mohammed Ghazali: Historical figure. An invader of India. His attacks are used as an argument that violence is not a new concept, and not unique to one religion.
    4. Subhashree: A person who is referenced in connection to price gouging, she paid an inflated price for gas at the pump.
    5. Usman: Is referenced in connection to inflated gas prices.
    6. Modi (Sahab): Current Prime Minister of India. He is criticized for creating division between Hindus and Muslims, and for actions in Kashmir. However the speaker later admits that he believes the average Indian has a sense of pride in Modi’s India, as they have a habit of respecting their leader.
    7. Mahatma Gandhi: Indian independence leader. His political views and death are discussed in detail. He is portrayed as being non-sectarian, but the speaker also acknowledges the narrative that he was killed because some thought he favored Muslims.
    8. Nathuram Godse: Gandhi’s assassin. He is described as being tied to the Rashtriya Swayamsevak Sangh (RSS).
    9. Jinnah (Sahab): Leader of the Muslim League, the individual primarily responsible for the creation of Pakistan. He is presented as a leader with few options and that was simply following the will of the people.
    10. Allama Iqbal: A well known writer.
    11. Rabindranath Tagore: A well known writer.
    12. Javed: The son, or son-in-law of a famous writer, who isn’t well known. The speaker says he doesn’t want to have his thinking spoiled by such nonsense and claims that he prefers to read people like Bal.
    13. Bal: A writer who has been read by the speaker and whom the speaker is very impressed by.
    14. Swami Vyas: Someone whom the interviewer did not speak with.
    15. Unnamed interviewer (You): The person conducting the interview with the primary speaker, and is frequently addressed by the primary speaker to clarify their point.

    Additional Notes: *The text is from a conversational setting, the speaker often digresses into different topics. *Some of the names could be misspelled, given the nature of the conversation.

    • There are varying levels of specificity as to when events happened. Some have specific dates, some have a general time frame, some are completely unclear as to when they occured.

    I hope this is helpful! Let me know if you have any other questions.

    India-Pakistan Relations: Conflict and Hope

    India-Pakistan relations are complex and have a history of conflict and tension [1, 2]. Here’s an overview of the key points discussed in the sources:

    • Historical tensions: The partition of India led to violence and displacement, with Hindus and Muslims being selectively killed [3]. The creation of Pakistan was not universally agreed upon [4].
    • Kashmir: Kashmir is a sensitive region with a majority Muslim population [2]. Article 370, which granted special rights to the people of Kashmir, was removed [2, 4]. This action has been a point of contention, with some arguing that it was not necessary for the unity of India [4].
    • Accusations and mistrust: Some accuse Pakistan of being India’s biggest enemy [1]. Some believe that India’s current government has injected “poison” into the country by creating divisions between Hindus and Muslims [2]. There is also a sense of mistrust between the two countries [1].
    • Economic disparities: Pakistan’s economy is struggling, while India’s is growing rapidly [1, 5]. India’s population size is seen as an economic advantage, while Pakistan’s economy suffers from a lack of resources [1]. The prices of basic goods like onions and tomatoes are much higher in India than in Pakistan [1].
    • Calls for peace and understanding: Despite the conflicts, there are calls for justice, peace, and understanding between the two countries [5, 6]. Some people believe that the focus should be on humanity and not on religious differences [7]. There is a desire to move past the divisions and focus on the common problems faced by both countries [6]. There are people who feel that Pakistan is like India and they don’t consider religion or politics important [3].
    • Internal issues: The sources also address issues within India, such as the unequal distribution of wealth [5], unemployment [5], and the mistreatment of minorities [2]. It is argued that these problems are not caused by Pakistan but are internal to India [5].

    In summary, the sources reveal that India-Pakistan relations are marred by historical conflicts, territorial disputes, economic disparities, and internal issues. Despite these challenges, there are also voices calling for peace, understanding, and a focus on shared humanity.

    Hindu-Muslim Relations in India

    The sources discuss religious harmony in the context of India, primarily focusing on the relationship between Hindus and Muslims. Here’s a breakdown of the key points:

    • Historical Coexistence: Hindus and Muslims have lived together in India for thousands of years [1]. There was peace in India even before the Mughals [2]. This long history of coexistence suggests an underlying potential for harmony.
    • Divisions and Tensions: Despite the historical coexistence, there are tensions between the two communities [2]. Some feel that the current government has created divisions between Hindus and Muslims, injecting “poison” into the country [2]. The sources suggest that the atmosphere has been spoiled, with people identifying each other primarily by their religious affiliation (“you are a Hindu, I am a Muslim”) [1, 2]. This division is a cause of concern for some [1].
    • Calls for Unity: There are calls for unity, with people expressing the view that religion should not be a primary identifier [3]. They emphasize that humanity is paramount and that all people should be treated equally, regardless of their religion [3]. Some individuals see all Indian Muslims and Hindus as their own [1].
    • Misguided Actions and Misinformation: Some believe that misleading writings have divided the people and that they should not be misled by these things [3]. There is also the idea that people should not follow a particular “push” or agenda that divides them [4].
    • Importance of Justice and Equality: The sources stress the importance of justice and equality for all, regardless of caste or religion [5]. There is concern that the government is not treating all citizens equally and that some groups are being marginalized [2]. There are calls for the government to consult with religious leaders before making decisions that could affect their communities [6].
    • Uniform Civil Code Concerns: There are concerns about the implementation of a Uniform Civil Code, with some religious scholars fearing that Muslims will be trapped by it [6]. Some feel that the government should consult with religious leaders before implementing such a code [6]. The concern is that some principles of various religions might not align with a uniform code [6].
    • Focus on Humanity: Many believe that humanity should be the guiding principle, rather than religious divisions [3]. They believe that if there is humanity, then there is no need for concern about religious differences [3].

    In summary, while the sources acknowledge the existence of religious harmony in India’s past, they also highlight the present tensions and divisions. However, there are also strong calls for unity, justice, and a focus on shared humanity over religious identity. The sources emphasize that the path to religious harmony involves overcoming misinformation, promoting equality, and prioritizing the common good over divisive agendas.

    India’s Political Climate: Government, Citizens, and the Future

    The sources touch on political discourse in India, particularly concerning the relationship between the government and its citizens, as well as the broader political climate. Here’s a breakdown of the key themes:

    • Government Accountability and Actions: There is a significant focus on the actions and responsibilities of the government. The sources discuss the government’s role in maintaining law and order, ensuring justice, and managing the economy [1, 2]. There are concerns that the government is not always effective in these areas. For example, it is suggested that a weak administration may fail to arrest wrongdoers, and that the government isn’t doing enough to control rising prices [1, 2].
    • Criticism of the Current Government: The sources express criticism of the current government, with some claiming that it has “ruined the pride of India” and injected “poison” into the country by creating divisions between Hindus and Muslims [3]. Some believe that the government favors Hindus, while neglecting Muslims, and there is a view that the government’s actions have made it hard for Muslims to be happy [3]. The sources suggest that the government needs to address the concerns of all citizens, not just specific groups [3, 4].
    • Article 370 and Kashmir: The removal of Article 370, which granted special rights to Kashmir, is discussed as a controversial political move [3]. Some argue that this action was not necessary for the unity of India and that it has led to unrest in the region [3].
    • Unequal Wealth Distribution: The sources highlight the issue of unequal wealth distribution in India [5]. It is argued that the government’s policies have favored those who are already wealthy, leaving the common man struggling with unemployment and financial hardship [5]. This is a theme throughout the discussion, where the economic policies of the government are being scrutinized as well as their affect on citizens [2, 5].
    • Importance of Citizen’s Rights: The sources emphasize the importance of protecting the rights of all citizens [6]. It is argued that the Indian Constitution is a blessing for everyone and that the state should protect the rights of every citizen [6]. There is a concern that these rights are not being adequately protected.
    • Calls for Dialogue and Consultation: There is a call for the government to engage in dialogue with religious leaders and other stakeholders before making major policy decisions [4]. This is particularly relevant in the discussion about the Uniform Civil Code [4]. Some believe that the government is rushing into these decisions and that it needs to consult with people to understand their concerns [4].
    • The Legacy of Gandhi: The sources discuss the legacy of Mahatma Gandhi, who is portrayed as a leader who did not favor one group over another [7, 8]. He is contrasted with current political figures and policies and there is some discussion around the circumstances surrounding his death [7, 8].
    • Political Parties and Ideologies: There is reference to the Rashtriya Swayamsevak Sangh (RSS) as an extreme organization [7]. The sources also discuss how some people view the current government as aligned with the ideology of Gandhi’s assassin [8]. There’s a discussion about how supporting a political party is different from adopting its policies [8].

    In summary, the sources reveal a critical perspective on the current political discourse in India. There is a strong emphasis on government accountability, equal treatment of all citizens, and the importance of dialogue and consultation in the decision-making process. The sources suggest that there are concerns about the government’s actions and policies, as well as calls for a more inclusive and just approach to governance.

    Social Justice in India

    The sources address social justice in India, particularly focusing on issues of equality, fairness, and the treatment of marginalized groups. Here’s a breakdown of the key points related to social justice:

    • Equality and Discrimination: The sources highlight concerns about discrimination and inequality within Indian society [1-3]. There’s a perception that the government favors certain groups (Hindus) while neglecting others (Muslims) [4]. The discussion about the Uniform Civil Code raises concerns that it may disproportionately affect Muslims [5]. There are also concerns that certain people are being targeted and singled out because of their religious affiliation [1].
    • Unequal Wealth Distribution: The sources indicate that there is an unequal distribution of wealth in India, with the benefits of economic growth not reaching the common man [2]. This economic disparity leads to unemployment and financial hardship for many [2]. The government’s policies are criticized for allegedly favoring those who are already wealthy, exacerbating the problem of inequality [2].
    • Justice System and Administration: The sources discuss the importance of a fair and effective justice system [6]. There are concerns that the administration may be weak or biased, failing to arrest wrongdoers and enforce the law equally [1, 6]. There is the suggestion that when the administration is weak, it does not address wrongdoings, and that this can lead to injustice [1].
    • Marginalized Groups: The sources emphasize the importance of protecting the rights of all citizens, particularly those of marginalized groups [4]. The discussion about Article 370 highlights the concerns about the rights of the people of Kashmir, who are a majority Muslim community [4]. There are references to the mistreatment of Muslims in India [1].
    • The Role of Religion: The sources touch on how religious identity can be a source of both unity and division [4]. The sources suggest that some people are being treated differently based on their religious affiliation [1]. However, there are also calls for unity, with people expressing the view that humanity is paramount, and that all people should be treated equally, regardless of their religion [7]. The sources emphasize that there should be justice for all, irrespective of religion [1].
    • Calls for Reform: The sources reveal calls for social and economic reforms to address these injustices [6, 7]. There is an emphasis on the importance of dialogue and consultation with religious leaders and other stakeholders before making major policy decisions that may affect their communities [5]. There are discussions about the need to address the root causes of division and inequality in the country [7].
    • Need for a Just Society: The sources indicate that there is a desire for a just society where all citizens are treated fairly and equally, where the government protects the rights of all people, and where justice is applied to all regardless of religious affiliation [1, 6].

    In summary, the sources reveal significant concerns about social justice in India. These include issues of religious discrimination, economic inequality, an ineffective justice system, and the mistreatment of marginalized groups. The sources also highlight calls for reforms and a more just society where all people are treated equally. The overall message is that India has significant challenges to address to ensure that it lives up to its ideals of equality and justice for all.

    India’s Wealth Inequality: A Critical Analysis

    The sources discuss wealth distribution in India, highlighting concerns about inequality and its impact on various segments of society. Here’s a breakdown of the key points:

    • Unequal Distribution: The sources indicate that wealth distribution in India is not equal [1]. It is suggested that the benefits of economic growth are not reaching the common man and are primarily going to those who are already wealthy and “good in the eyes of the government” [1].
    • Economic Hardship for the Common Man: The unequal distribution of wealth leads to unemployment and financial hardship for many ordinary people [1]. The sources suggest that there is a significant gap between the wealthy and the working class, with many people struggling to make ends meet.
    • Government’s Role: The government’s economic policies are criticized for allegedly favoring the already wealthy, which exacerbates the problem of inequality [1]. The sources suggest that the government is not doing enough to address the economic struggles of the common man and that the current system reinforces existing wealth disparities.
    • Rising Prices: The sources discuss the issue of rising prices of essential commodities, like onions and potatoes, which can cause significant hardship for ordinary people [2]. It is suggested that these prices are not being effectively regulated by the government and that this disproportionately affects those with fewer resources.
    • Economic Growth vs. Equity: While India’s economy is said to be growing rapidly and is now the 5th largest in the world, the sources question whether this growth is benefiting all citizens [2]. The sources imply that economic growth alone is not sufficient if it is not accompanied by equitable distribution of wealth. There is a concern that the benefits of economic growth are not reaching the working class [1].
    • Monopolies and Economic Manipulation: The sources reference the idea of creating a “monopoly” to increase profits, suggesting that some businesses may be manipulating the economy to their own advantage [2]. There is a concern that the government may not be doing enough to prevent these kinds of practices.
    • Comparison with Other Countries: The sources compare the prices of certain goods in India to those in other countries, such as Pakistan, Bangladesh and Nepal, suggesting that India’s economic performance is not as good as it might seem [1, 2]. This highlights that relative economic metrics may not tell the whole story.
    • Lack of Representation: The sources indicate a lack of representation of the working class in society [1]. This suggests that those most affected by unequal wealth distribution may not have a voice in the decision making process.

    In summary, the sources portray a situation where wealth is not being distributed fairly in India, leading to economic hardship for many. The sources suggest that the government’s policies and actions may be contributing to the problem, rather than solving it. There’s a clear emphasis on the need for economic reforms that promote a more equitable distribution of wealth and ensure that the benefits of economic growth are shared by all citizens.

    By Amjad Izhar
    Contact: amjad.izhar@gmail.com
    https://amjadizhar.blog

  • Muridke My Beloved City from my Childhood Sheikhupura Tehsil Muridke: A Tour and Notable Figures

    Muridke My Beloved City from my Childhood Sheikhupura Tehsil Muridke: A Tour and Notable Figures

    This source presents an overview of Tehsil Muridke, located in the Sheikhpura district. The speaker in the video describes the tehsil’s history, including its former name and the establishment of a town by the British government near the railway station. The video also mentions key locations within the tehsil, such as Galla Mandi, Rail Bazar, and Kala Shah Kaku. It highlights the presence of various government institutions, hospitals, schools, and a sports complex. Finally, the video names prominent figures from the area As Rana Tanvir Hussain, primarily cricketers who have gained international recognition for Pakistan. The speaker hopes the video will be well received and promises future informative content.

    Rana Tanvir Hussain

    Tanveer Hussain: Public Accounts, Politics, and Personal Reflections

    This source presents a wide-ranging interview with Tanveer Hussain, a Pakistani politician. The discussion spans topics from his personal life and political career to broader issues facing Pakistan. Hussain shares anecdotes about his childhood, reflects on his time in public office, and offers his opinions on contemporary political figures and events. He addresses allegations of corruption, discusses challenges facing the country, and reveals his preferences in food, entertainment, and personal philosophy. Throughout the interview, Hussain offers insights into his character and worldview, providing a glimpse into the complexities of Pakistani politics and society.

    Tanveer Hussain: A Study Guide

    Quiz

    Instructions: Answer the following questions in 2-3 sentences each, based on the provided excerpts from “Tanveer Hussain: Public Accounts, Politics, and Personal Reflections.”

    1. What position did Ajay hold in the Muslim League of Nations, and who was his senior leader?
    2. What is Tanveer Hussain’s perceived public persona regarding his temperament, and how does he respond to this perception?
    3. According to Tanveer Hussain, what role did his family, particularly “Balo sahab,” play in his career?
    4. What issue regarding changes around New Delhi does Tanveer Hussain mention, and how does it relate to his political career?
    5. What percentage of deep change was made when Tanveer Hussain left his role?
    6. What is Tanveer Hussain’s approach to project completion, and how does it differ from the perceived norm?
    7. What examples of martial law during his grandfather’s and his time does Tanveer Hussain recall?
    8. What does Tanveer Hussain say regarding the conscience and what should be given so that Raghavan knows?
    9. According to Tanveer Hussain, what was one of the reasons for the People’s Party wanting to give a dharna?
    10. What was one of Tanveer Hussain’s favorite actors and one of his favorite actresses from that era?

    Quiz Answer Key

    1. Ajay was the Chairman of the Public Accounts Committee of the Muslim League of Nations. His senior leader was Tanveer Hussain.
    2. Tanveer Hussain is perceived as strict and bitter, easily saying harsh words. He acknowledges being an angry man but claims he tries to avoid “massage” (conflict) even in normal situations.
    3. His family, especially “Balo sahab,” played a significant role in putting him in the field and influencing his political career, including some “Adani treatment political.”
    4. He mentions that when changes around New Delhi are written about, the “A of change” gets suppressed or finished. He talks about how things can be improved, but there is a little resistance in it.
    5. When Tanveer Hussain came to his role, the percentage was at 12%, but when he left, it was 4%. Therefore, 8% was the total amount of deep change.
    6. Tanveer Hussain’s approach was to focus on ensuring every project in his area, like those started by the Delhi government, gets completed according to the rules. He did not want one project to be completed and others to be left undone.
    7. He recalls martial law being imposed during his grandfather’s time and again during his time, mentioning the imposition of 200 “Vimaanchaan” (restrictions) in March.
    8. Tanveer Hussain says that whatever you know about the conscience, you should give so that Raghavan till today knows.
    9. Tanveer Hussain states that he cannot say if the People’s Party and the establishment are on the same page, but the way the People’s Party wanted to give a dharna might explain that they are not.
    10. One of Tanveer Hussain’s favorite actors was Ibrani the great, and his favorite actress was Meena.

    Essay Questions

    Instructions: Choose one of the following essay questions and write a well-structured essay based on the provided source material.

    1. Analyze Tanveer Hussain’s leadership style and political philosophy as revealed in the interview. Support your analysis with specific examples from the text.
    2. Discuss the challenges and obstacles Tanveer Hussain faced during his political career, drawing on evidence from the excerpts.
    3. Explore the role of family and personal background in shaping Tanveer Hussain’s political identity and trajectory.
    4. Examine Tanveer Hussain’s views on governance, corruption, and social change, providing textual evidence to support your claims.
    5. Evaluate Tanveer Hussain’s self-perception and public image, comparing and contrasting his own assessment with the interviewer’s perspective.

    Glossary of Key Terms

    • Public Accounts Committee: A legislative committee responsible for examining the government’s expenditures and financial accounts.
    • Muslim League of Nations: A political party (as identified in the text).
    • Adani Treatment Political: An apparent reference to specific political treatments or situations involving or like Adani (needs more context to be specific).
    • Dhanush Yagya: A specific administrative plan or project (as identified in the text).
    • Vimaanchaan: Restrictions or limitations (as identified in the text).
    • Ehsaas Program: A specific social welfare or poverty alleviation program (as identified in the text).
    • Langar Khana: A community kitchen or free food distribution center, often associated with religious institutions.
    • Vote Bank: A group of voters who consistently support a particular political party or candidate.
    • Dharna: A form of protest or sit-in demonstration.
    • PTI Cats: Reference to political party debt.

    Tanveer Hussain: Politics, Governance, and Personal Reflections

    Okay, here’s a briefing document summarizing the main themes and important ideas from the provided excerpt of “Tanveer Hussain: Public Accounts, Politics, and Personal Reflections.”

    Briefing Document: Tanveer Hussain Interview Analysis

    Source: Excerpts from “Tanveer Hussain: Public Accounts, Politics, and Personal Reflections” (translated)

    Main Themes:

    • Political Life and Career: The interview provides insights into Tanveer Hussain’s political career, focusing on his role as Chairman of the Public Accounts Committee of the Muslim League of Nations, and various political events that shaped his trajectory.
    • Personal Philosophy and Character: The interview explores Tanveer Hussain’s personality, his approach to leadership, his values, and his reflections on life experiences.
    • Governance and Development: The conversation touches upon topics related to governance, development, and specific projects undertaken during his time in power, including discussions about infrastructure, education, and social welfare.
    • Party Politics and Alliances: The interview delves into the dynamics of party politics, including pressures faced within the party, defections, alliances, and the ever shifting political landscape.
    • Elections and Electoral Processes: There is considerable discussion of elections, including concerns about electronic voting machines, rigging allegations, and the integrity of the electoral process.
    • Social and Cultural Reflections: The interview also touches upon social and cultural aspects, including reflections on women, entertainment, and personal preferences.

    Key Ideas and Facts:

    • Personal Traits: Tanveer Hussain acknowledges being perceived as “strict and bitter” and “an angry man,” but claims he tries to avoid unnecessary conflict.
    • “You are a very strict and bitter man. How can you say harsh words very easily? I think people should understand that I am a very angry man, but this promise is also correct. I try to avoid massage even in normal ways…”
    • Early Life and Influences: He mentions being born in Shahpura and credits his family for his involvement in politics and public service.
    • “Born in Shahpura and reached the wire fences what kind of environment was around you in your childhood which helped you in deciding the self of life we ​​will increase things, we will make arrangements now we did it in between 10-12 I did it but later I came to know that there are changes around New Delhi…”
    • Development Efforts: He highlights efforts made during his tenure to improve infrastructure, electricity access, and education enrollment, claiming significant progress in these areas.
    • “…with Bhargava’s vision we tried to work in the social sector relief to the people these facilities so basic they should also be given a lot of lettuce and in that the account was less successful the second infrastructure is the matter of electricity fixed enrollment or people got inflation the whole thing will be that when we came the total percentage was made 12 per cent so when we left 4 percent we made deep change…”
    • Project Management: He emphasizes his focus on ensuring projects are completed on time and according to regulations, preventing selective focus on certain projects over others.
    • “Subhash, the project on which you used to focus, it used to get completed before time, my point was that till Rajanpur Chilli, every project or every place is getting delivered as per the rules, evening, if any 20 projects have started in my area by the Delhi government, if I focus on one then it should get completed, but the other one should not be completed, this should not happen in front, that is called Bigg Boss, who is delivering a behavior to every gram individual…”
    • Martial Law memories: Hussain recalls the era of martial law and the imposition of restrictions during his grandfather’s and his own time.
    • “…I will tell you one interesting thing that all the March holidays that were imposed when martial law was imposed, you take that in my grandfather’s time and while filling 98100 in my time, 200 Vimaanchaan was imposed that in nine March, the statue was run, if our family saw, then we in order Ghagra because we made it too and it is said that you have very good people with you so different sir both are hot fruits of recovery correction market second was theirs general they had hair of love type so Ghagra accident happened, birth story is being written second is doing it from top and from top to bottom and according to their own so these people are and channel and according to their work we should move forward…”
    • Party Defections: He addresses the issue of people leaving the party, mentioning potential offers and the importance of conscience.
    • “…till today someone knows that I am myself now how much symptoms maybe in the party itself If we finish then because of two statements that how difficult it is for the leadership and on which side do you feel yourself to stand, Mohammad is a word of love, it was a protected statement due to the media asking questions…”
    • Allegations of Corruption: The interview references allegations against political figures, including accusations of corruption and money laundering.
    • “…the way People’s Party wanted to give a dharna, when we wanted to talk, the way they have retreated a little from there, if the arrest is made, then today you would not have got any opinion, they would have done it, they must have some thinking, but the way this thing is going on, this prayer you help matter, give honey and People’s Party in any of their shops, first in Punjab and then in the next phase, Markaz also had an India, then why did you people like me, Ramesh, it could be an explanation of the role Punjab played during that period…”
    • Views on Imran Khan: He critiques Imran Khan’s governance and his actions, specifically regarding electricity pricing.
    • “you used to say that if there were Chinese banks, then the Prime Minister is a thief, you wanted electricity to be expensive, cars, chillies and all these things, will we do it? No, now we will do it, right? People are calling it thief, you tell us the formula, because if the rate of electricity is increased, then the Prime Minister is a thief, if petrol is expensive, then the Prime Minister is a thief, and if the dollar is expensive, then the Prime Minister is a thief, let’s talk about it…”
    • Electronic Voting Machines: Concerns are raised about the reliability and vulnerability of electronic voting machines.
    • “… talks of this hand have been going on in your race also but now what do you people have to do with the electronic voting machines, the British Raw Race which we brought, we had a lot of management but we did some 40 crores on which the total position was right in the intoxication, rich parliament I took refuge in their consensus, why is CTI fighting with us, so a committee was formed, Jasmine skin was expensive, it was such a Dungar, the CSP was clear, they said yes to it, we did 401 cream, the rest we did not do and we had also tried the voting machine once, but we saw that it is not that strong and its rejection is what we want to do, the answer is that a correct election poll cannot be done under election alarms and many other things can be done under it, under this the election commission can do the post only on the voting machine because it is stuck…”
    • Personal Preferences: He shares his enjoyment of music and movies, mentioning old Indian films and favorite actresses. He also expresses a fondness for certain foods and places.
    • “Let me tell you what can be shown on camera, it is painful but the thing is that I am very fond of some things, that is to say ginger, when this path is full, to the launch network, many songs should be sung, it is good and there are songs of a cycle and many more songs are also there in me today and I listen, I used to keep a record player in college also and then came the tape recorder, I used to keep that too, so long play, that they used to consider India Se Swagat, clock play in which there are more songs of singer, so that Mumtaz was not made near our college and it was available nearby, so we used to take from there, Akshay, Bomb, Prateek, Rafi’s all these are false and good games…”

    Overall Assessment:

    The interview provides a multifaceted glimpse into the life and career of Tanveer Hussain, offering valuable insights into Pakistani politics, governance challenges, and personal reflections. However, due to the fragmented nature of the transcript and potential translation issues, some aspects may require further clarification. The interview reveals a politician who is both reflective and opinionated, willing to engage in discussions about controversial topics and share personal anecdotes.

    Tanveer Hussain: Public Accounts, Politics, and Personal Reflections

    Tanveer Hussain FAQ: Public Accounts, Politics, and Personal Reflections

    1. Can you describe your personal approach to your role as Chairman of the Public Accounts Committee, particularly when dealing with sensitive issues?

    My style is direct and complete. I am known for being strict and perhaps even bitter, but I believe in avoiding superficialities. While I strive to be fair, I also don’t shy away from harsh words when necessary. I try to work as part of a team, focusing on achieving results, and making sure that projects are delivered on time.

    2. What are some of the key changes or reforms you attempted to implement during your time in power?

    We tried to work on the social sector providing relief to the people with basic facilities. Some of the key areas we focused on included infrastructure, electricity, and fixed enrollments. We managed to significantly reduce the percentage of inflated costs in projects from 12% to 4%.

    3. You mentioned focusing on project completion. How did you ensure projects were completed on time and according to regulations?

    My priority was ensuring every project, from Rajanpur to Chilli, adhered to regulations and timelines. If the government of Delhi initiated twenty projects in my area, my focus was on ensuring every project was completed on time and according to regulations.

    4. What is your opinion on the current state of Pakistan’s political leadership and governance, particularly concerning corruption and debt?

    The current state of political leadership and governance leaves something to be desired. I question the transparency of financial arrangements with entities like Chinese banks, and believe that the current method of how the Prime Minister is deemed a “thief” is not being properly addressed.

    5. What is your stance on electronic voting machines and the fairness of elections in Pakistan?

    I have concerns about the reliability of electronic voting machines. I believe a correct and fair election process cannot be guaranteed if the election commission only relies on voting machines.

    6. The interview touches on pressure from within the party and offers you may have received. Can you elaborate on these experiences and why you remained committed to your path?

    Yes, I have faced pressure from within the party and received offers that would compromise my ideals. However, my loyalty lies with my conscience and standing up for justice, this has caused me to remain committed to my principles even amidst difficulties.

    7. What are your thoughts on the role of family legacy and inherited privilege in politics?

    I acknowledge that family legacy can be a tool, but it does not guarantee capability. The son of a doctor may not necessarily become a doctor, and the sons of landowners might pursue different paths. Ultimately, individual merit and competence are essential.

    8. What are some of your personal interests and leisure activities that provide you with a break from the pressures of politics?

    Away from politics, I appreciate solitude and enjoy listening to music. I am fond of old Indian films and music, and I also enjoy spending time with friends.

    Tanveer Hussain: Politics, Governance, and Personal Reflections

    Tanveer Hussain is a senior leader associated with Ajay, who is the Chairman of the Public Accounts Committee of the Muslim League of Nations. The source text provides insights into his background, personality, political views, and personal preferences:

    • Personality and Approach: Tanveer Hussain acknowledges being perceived as strict and bitter, admitting he can use harsh words easily. He describes himself as an angry person but also someone who avoids flattery.
    • Political Involvement and Reflections:He was born in Shahpura and discusses his journey to higher political positions.
    • He reflects on changes that occurred during his rule, particularly in the social sector and infrastructure, such as improvements in electricity and enrollment rates. He notes that while they achieved a decrease in a certain percentage from 12 to 4 percent, he felt they could have done more.
    • Hussain mentions his focus on ensuring projects were completed on time and delivered to every individual, highlighting his attention to detail and execution.
    • Views on Governance and Leadership:He expresses concern over corruption and the need for accountability.
    • Hussain talks about the qualities and labels of delivery being attached to the claimant government of Delhi.
    • He reflects on the challenges of working with elected officials and the importance of leaders completing their terms.
    • Personal Preferences and Interests:He enjoys being alone and away from people.
    • He has an interest in music, particularly old songs, and used to keep a record player and tape recorder.
    • He enjoys watching movies and reminisces about going to see Indian films with friends.
    • Encounters and Views on Prominent Figures:He shares anecdotes about his interactions with various political figures and his perspectives on their actions.
    • He mentions figures like Imran Khan, Nawaz Sharif, and Bilawal Bhutto Zardari, offering brief assessments of their political standing and actions.
    • Views on Elections and Political Processes:He expresses skepticism about electronic voting machines and discusses the importance of fair elections.
    • Hussain touches on the role of the Election Commission and the potential for manipulation in the electoral process.
    • Social and Cultural Observations: He reflects on societal changes, cultural preferences, and the importance of community support.

    Tanveer Hussain’s Political Reflections

    Tanveer Hussain’s political reflections, as presented in the source text, cover a range of topics, including his personal experiences, observations on governance, and views on prominent political figures and processes.

    Key aspects of his political reflections include:

    • Governance and Leadership Hussain reflects on his efforts to bring about change during his time in power, specifically in the social sector and infrastructure. He emphasizes the importance of project completion and delivering results to individuals. He also touches on the difficulties of working with elected officials and the need for leaders to fulfill their terms.
    • Corruption and Accountability He voices his concerns about corruption and the necessity for accountability in governance.
    • Electoral Processes Hussain expresses skepticism regarding electronic voting machines and emphasizes the need for fair elections. He also comments on the role of the Election Commission and the potential for manipulation.
    • Political Figures Hussain shares his views on various political figures, such as Imran Khan, Nawaz Sharif and Bilawal Bhutto Zardari, providing insights into their political positions and actions.
    • Party Politics Hussain reflects on his experiences within his own party, including instances of people leaving and offers being made. He also touches on the challenges of leadership and the importance of standing by one’s principles.
    • Social Impact and Personal Involvement He mentions his work in the social sector, aiming to provide basic facilities and relief to the people. Hussain also reflects on his interactions with the public, noting his regular meetings with constituents to address their problems.
    • Statements and Media Hussain also touches on how statements can be misinterpreted by the media.
    • Views on Elections and Political Processes: He expresses skepticism about electronic voting machines and discusses the importance of fair elections. Hussain touches on the role of the Election Commission and the potential for manipulation in the electoral process.

    In essence, Tanveer Hussain’s reflections offer a multifaceted view of Pakistani politics, shaped by his personal experiences, observations, and perspectives on key issues and figures.

    GNN Kay Sang with Rana Tanveer Hussain | Mohsin Bhatti | 19 September 2021
    Street Visit Muridke Canal Park – Walking Tour Mureedkey
    Muridke Bangla Puli – Motorcycle Ride – HD – Canal Park Mureedkey Pakistan
    Local Bazaar Muridke Sheikhupura Punjab Pakistan | Main Bazaar | Muridke City Sheikhupura
    Muridke CITY STREET VIEW 2020 – Drive through Muridke Punjab Pakistan – Muridke City Tour – 4K HD
    Muridke City tour // Mall of Muridke // Muridke housing society || Narowal chowk Muridke || F16
    History & Documentary of Muridke City | Muridke City Tour | مریدکے کی سیر
    Domino’s Pizza Muridke Vlog 2020 || Mall of Muridke || Muridke Food Street || My HomeTown #Muridke

  • Al Riyadh Newspaper: March 02, 2025 Kingdom News and Ramadan Events

    Al Riyadh Newspaper: March 02, 2025 Kingdom News and Ramadan Events

    This compilation of articles from a Saudi Arabian newspaper covers diverse topics. Several articles focus on Saudi Arabia’s internal affairs, including the Kingdom’s rejection of a parallel government in Sudan, initiatives like “Good of the Regions” receiving royal support, water distribution plans for Ramadan, and the Ministry of Interior receiving an innovation award. International affairs are also addressed, such as Saudi Arabia’s stance on the Kurdistan Workers’ Party and the global natural gas market. Additionally, the publication highlights local events, such as the launch of registration for providing meals at the Prophet’s Mosque, Ramadan cultural events in various cities, and court announcements in Riyadh. Finally, the publication also provides sports coverage, including football and volleyball results.

    Study Guide: News Articles from March 2, 2025

    I. Quiz: Short Answer Questions

    1. What was the King’s message regarding the service of the Two Holy Mosques, and what royal directive was issued?
    2. What is the Kingdom’s stance on the formation of a “parallel government” in Sudan, and what does it urge Sudanese parties to do?
    3. What is the goal of the housing support campaign during Ramadan, and which organization is leading the effort?
    4. What commitment did the Lebanese Prime Minister make regarding the reconstruction of damaged homes and villages in southern Lebanon?
    5. What is the Saudi government’s plan for water distribution during Ramadan, and what is the purpose of this plan?
    6. What award did the Ministry of Interior receive, and what strategic goal does this achievement support?
    7. What is the purpose of designating seasonal locations for Ramadan stalls in Tabuk?
    8. What are some of the key elements highlighted in the Imam’s Friday sermon at the Prophet’s Mosque in Medina during Ramadan?
    9. According to Dr. Khalid Ramadan, what has been the historical outcome of imposing customs duties, and how does this relate to the current trade war?
    10. What did the US president and the Iraqi oil ministry say about oil production?

    II. Quiz Answer Key

    1. The King affirmed that serving the Two Holy Mosques is a tradition followed by Saudi monarchs since the kingdom’s unification. A royal directive was issued to begin releasing prisoners held for public rights offenses.
    2. The Kingdom rejects the idea of a “parallel government” in Sudan, viewing such actions outside formal institutions as illegitimate. It urges Sudanese parties to prioritize the country’s interests and unity, working to avoid division and chaos.
    3. The campaign aims to provide suitable housing for eligible families. The “Sakan” Developmental Housing Foundation is spearheading the initiative through the “Jood Al-Iskan” platform.
    4. The Lebanese Prime Minister pledged his government’s commitment to working on the reconstruction of homes and villages destroyed in southern Lebanon.
    5. The plan is to distribute approximately 10 million cubic meters of water daily throughout the Kingdom during Ramadan to ensure an adequate supply for residents and visitors during the peak demand season.
    6. The Ministry of Interior received the Global Innovation Institute’s (CGInO) accreditation award. This achievement supports the strategic goals of Saudi Vision 2030 by fostering a culture of institutional innovation.
    7. The purpose is to organize street vending during the month of Ramadan by providing designated locations that serve residents and visitors and meet their needs.
    8. The Imam stressed the importance of taking advantage of Ramadan for worship, repentance, charity, and abstaining from sins and wrongdoings.
    9. Dr. Ramadan claims that custom duties have historically failed to achieve their economic objectives, often leading to retaliatory measures and trade wars. He suggests this pattern is relevant to the current trade tensions.
    10. US president Donald Trump said proposed tariff measures would be implemented and Iraqi oil ministry said Iraq would continue exporting.

    III. Essay Questions

    1. Analyze the interconnectedness of domestic and foreign policy initiatives presented in the articles. How do events in Sudan, Lebanon, and other international contexts relate to Saudi Arabia’s internal goals and Vision 2030?
    2. Discuss the various aspects of Saudi Vision 2030 highlighted in these articles. What are the key areas of focus, and how are these goals being pursued through specific projects and initiatives?
    3. Examine the role of culture and tradition in contemporary Saudi society as portrayed in the context of Ramadan and the celebration of Founding Day. How are these values integrated with modernization and development?
    4. Assess the economic trends and challenges discussed in the articles, particularly in relation to energy markets, trade policies, and diversification efforts. How are these factors shaping Saudi Arabia’s economic landscape?
    5. Consider the humanitarian and social responsibility efforts described in the articles, including initiatives related to housing, community development, and international aid. What values and priorities are reflected in these activities?

    IV. Glossary of Key Terms

    • الحرمين الشريفين (Al-Haramain Al-Sharifain): The Two Holy Mosques, referring to the Masjid al-Haram in Mecca and the Prophet’s Mosque in Medina, the two holiest sites in Islam.
    • الحق العام (Al-Haq al-Aam): Public rights, referring to offenses against the state or society as a whole, as opposed to private rights which are offenses against individuals.
    • وزارة الخارجية (Wizarat al-Kharijiyyah): The Ministry of Foreign Affairs, the government body responsible for managing the Kingdom’s international relations.
    • واس (WAS): Saudi Press Agency, the official news agency of Saudi Arabia.
    • جود المناطق (Jood Al-Manatiq): “Goodness of the Regions,” a campaign focused on providing suitable housing for eligible families during Ramadan.
    • رؤية 2030 (Ru’yah 2030): Vision 2030, Saudi Arabia’s strategic framework for economic and social development, aiming to diversify the economy, promote sustainability, and enhance the quality of life.
    • نيوم (NEOM): A planned city in northwestern Saudi Arabia, designed as a futuristic hub for innovation, sustainability, and tourism, serving as a key manifestation of Vision 2030.
    • الرئاسة العامة لشؤون المسجد الحرام والمسجد النبوي (Al-Riasah Al-Aamah li-Shu’un Al-Masjid Al-Haram wal-Masjid Al-Nabawi): The General Presidency for the Affairs of the Grand Mosque and the Prophet’s Mosque, the government agency responsible for managing the two holy mosques.
    • الأونروا (UNRWA): United Nations Relief and Works Agency for Palestine Refugees in the Near East.
    • حزب الله (Hezbollah): A Lebanese Shia Islamist political party and militant group.
    • أوبك (OPEC): The Organization of the Petroleum Exporting Countries.
    • اليونيفيل (UNIFIL): United Nations Interim Force in Lebanon.

    Al Riyadh Newspaper Analysis: Saudi Arabia, March 2025

    Okay, here’s a detailed briefing document summarizing the main themes and ideas from the provided text excerpts.

    Briefing Document: Analysis of Al Riyadh Newspaper Excerpts (March 2, 2025)

    Executive Summary:

    These excerpts from the Al Riyadh newspaper, dated March 2, 2025 (2 Ramadan 1446H), cover a diverse range of topics concerning Saudi Arabia, the broader Islamic world, and global events. Key themes include:

    • Domestic Affairs: Focus on Ramadan preparations, charitable initiatives, innovation in government, cultural events, development projects (NEOM), and efforts to improve quality of life.
    • Foreign Policy: Saudi Arabia’s stance on regional conflicts (Sudan, Lebanon, Palestine), counter-terrorism efforts, and support for international initiatives (UNIFIL).
    • Economic Issues: Discussion of trade tariffs, gold prices, the natural gas market, and Saudi Arabia’s economic diversification efforts (Vision 2030).
    • Social and Cultural Matters: Emphasis on preserving Islamic values, promoting national identity, and highlighting cultural heritage.

    Detailed Analysis by Theme:

    1. Ramadan and Islamic Affairs:

    • The newspaper emphasizes the spiritual significance of Ramadan, describing it as a month “filled with spirituality, tranquility filling souls, faith, recitation of the Quran, and liberation from Hellfire.”
    • Reports on preparations for Ramadan, including the distribution of 10 million cubic meters of water daily throughout the Kingdom.
    • Coverage of charitable initiatives, such as the “Jood Al-Manatiq” campaign, which aims to provide suitable housing for deserving families. King and Crown Prince donate 150 million riyals for it. This campaign is described as being: “aimed at providing suitable housing for deserving families… to achieve family stability and contribute to improving the quality of life for them.”
    • Highlighting the “King Salman Award for Memorizing the Quran,” reflecting the Kingdom’s commitment to serving the Quran and encouraging its citizens to adhere to its values.
    • Mentions the “Guests of the Custodian of the Two Holy Mosques Program for Umrah,” where 250 pilgrims from 14 countries performed Umrah under the supervision of the Ministry of Islamic Affairs. The sheikh spoke to them about the importance of Ramadan.

    2. Foreign Policy and Regional Security:

    • Sudan: The Kingdom rejects the formation of a “parallel government” in Sudan, emphasizing its support for the country’s unity, security, and stability. The Foreign Ministry stated it “expressed its rejection of any illegitimate procedures taken outside the framework of the official institutions of the Republic of Sudan that may lead to forming a parallel government.”
    • Lebanon: The Lebanese Prime Minister affirmed his government’s commitment to rebuilding destroyed homes and villages in southern Lebanon. “That is not a promise.” He noted the importance of UNIFIL.
    • Palestine: Discussion of efforts to achieve peace and stability in Gaza, with a focus on reconstruction efforts.
    • Counter-Terrorism: The Kingdom welcomes the call to dissolve the “Kurdistan Workers Party,” expressing solidarity with Turkey and hoping for steps toward security, peace, and prosperity.
    • Kuwair: Kuwait announces it rejects any illegitimate procedures that take place outside of the framework of state institutions in Sudan.

    3. Economic Development and Vision 2030:

    • NEOM: The newspaper highlights NEOM as a leading example of Vision 2030, showcasing its focus on innovation, sustainability, and economic diversification. It aims to create a city of the future by attracting intellects and companies in order to develop advanced industries. It is also going to hold the winter games of 2029. It strengthened its media power by developing the media area.
    • Economic Diversification: Emphasizes efforts to diversify the Saudi economy beyond oil, highlighting investments in tourism, industry, and technology. “Vision 2030 came to draw a new future for development, based on innovation, sustainability, and economic diversification.”
    • Trade Tariffs: Discusses the potential impact of trade tariffs imposed by the United States, noting the historical failures of such measures.
    • Natural Gas Market: Reports on the increasing global demand for liquefied natural gas (LNG), particularly in Asia, and Saudi Arabia’s role in meeting this demand. LNG demand will increase by 60% in 2040. China is also increasing its LNG capacity.
    • Gold Prices: Mentions the impact of trade tensions and a rising dollar on gold prices.

    4. Domestic Affairs and Social Initiatives:

    • Innovation in Government: The Ministry of Interior receives an award for innovation, reflecting efforts to promote a culture of innovation within the government. The award is for “its leadership in innovation.”
    • Cultural Events: Highlights the Ministry of Culture’s initiative to celebrate Ramadan with various cultural and community events across the Kingdom, reflecting the values and customs of Saudi society.
    • Tabuk Development: Reports on the allocation of seasonal sites for Ramadan stalls in Tabuk to organize sales activities. 13 sites were chosen.
    • Healthcare: Highlights healthcare initiatives aimed at improving patient experience and safety.

    5. Social Issues:

    • Begging: An article discusses the complex social phenomenon of begging, moving from its exploitation to empowerment. People should only give alms to people who need it, “otherwise, you have wronged the one who deserves it.”
    • Fasting: Fasting is more than abstinence, it is philosophy. It is a call to improve ourselves.

    6. History

    • The Saudi Foundation was not a point of turn, but a historical memory. Ever since Saudi Arabia gained territory, it has been at the heart of the Middle East.
    • In 1938, the discovery of oil also boosted Saudi Arabia’s role in the international community, making it the focus for the worlds economy.
    • King Abdulaziz did not want to reach the rule.
    • The Saudi State was not like other countries, but is unique for joining authenticity and development.

    Quotes:

    • (On Ramadan): “filled with spirituality, tranquility filling souls, faith, recitation of the Quran, and liberation from Hellfire.”
    • (On Sudan): “expressed its rejection of any illegitimate procedures taken outside the framework of the official institutions of the Republic of Sudan that may lead to forming a parallel government.”
    • (On Jood Al-Manatiq): “aimed at providing suitable housing for deserving families… to achieve family stability and contribute to improving the quality of life for them.”
    • (Begging): “otherwise, you have wronged the one who deserves it.”

    Conclusion:

    These newspaper excerpts paint a picture of a Saudi Arabia that is actively engaged in domestic development, regional diplomacy, and global economic affairs. The Kingdom is presented as a modernizing nation that is committed to its Islamic heritage, its citizens’ well-being, and its role as a key player on the world stage. Vision 2030 serves as the guiding force behind many of these initiatives, demonstrating a forward-looking approach to governance and development.

    Saudi Arabia: Governance, Vision 2030, and Global Role

    Here is an 8-question FAQ based on the provided text excerpts:

    1. What is the focus of the Saudi Arabian government during Ramadan, as reflected in the news articles?

    The Saudi government focuses on several key areas during Ramadan, including:

    • Supporting Charitable Initiatives: The government emphasizes charitable giving and community support through initiatives like “Jood Al-Manateq” which aims to provide suitable housing for deserving families. King Salman and the Crown Prince support this with significant donations.
    • Providing Essential Services: Ensuring the availability of resources such as water. The National Water Company distributes millions of cubic meters of water daily to meet the increased demand during Ramadan.
    • Maintaining Religious Sites: Facilitating religious practices such as Umrah, with programs to host pilgrims from various countries.
    • Cultural Preservation: Celebrating and promoting Saudi cultural heritage through events and decorations, as seen with the Ministry of Culture’s Ramadan season.
    • Economic Activity Regulation: Continues oversight for safety and health in commercial activities during the month.

    2. What role does the Saudi government play in regional conflicts, specifically concerning Sudan?

    The Saudi Arabian Ministry of Foreign Affairs rejects any actions that take place outside the parameters of official institutions of the Republic of Sudan, as such actions may lead to the formation of a parallel government that does not express the will of the Sudanese people and threatens the security and stability of Sudan. The Kingdom calls on all Sudanese parties to prioritize the interests of Sudan, work to avoid division and chaos, and remain committed to ceasing all war efforts in order to achieve a peace in Sudan.

    3. What is the “Saudi Vision 2030” and how is it being implemented in various sectors?

    Saudi Vision 2030 is a strategic framework aimed at diversifying the Saudi economy, enhancing sustainability, and fostering innovation. Examples of its implementation across various sectors include:

    • Economic Diversification: Developing non-oil sectors like tourism, industry, and technology.
    • Urban Development: Implementing ambitious projects like NEOM, which seeks to establish a global model for future cities with advanced industries and attractive investment opportunities.
    • Human Capital Development: Investing in education and training programs to enhance the skills and qualifications of Saudi nationals, ensuring they meet the needs of the future job market.
    • Innovation: Encouraging and recognizing innovation in government and institutional settings.

    4. How is Saudi Arabia working towards innovation and technological advancement?

    Saudi Arabia is promoting innovation and technological advancement through several initiatives:

    • Government Support: The Ministry of Interior has received awards for its leadership in promoting institutional innovation and improving user experience.
    • Educational Investments: Universities like King Khalid University are focusing on strategic planning and aligning educational programs with the goals of Vision 2030.
    • Technology Projects: The establishment of NEOM as a smart city, integrating advanced technologies and attracting leading global companies.
    • Artificial Intelligence: Hail University is developing capabilities in areas like AI and robotics to develop student skills.

    5. What are the Saudi government’s efforts to support housing and community development?

    The Saudi government supports housing and community development through:

    • “Jood Al-Manateq” Campaign: An initiative providing suitable housing for deserving families.
    • Financial Contributions: King Salman and the Crown Prince have donated significant funds to support the campaign.
    • “Sakan” Platform: A platform aimed at improving the quality of life for Saudi citizens by providing adequate housing solutions.
    • Addressing Housing Needs: Emphasizing the need to provide housing solutions that contribute to family stability and improve quality of life.

    6. What challenges is the global economy facing, according to the articles, and what role is Saudi Arabia playing in addressing them?

    Global economic challenges include:

    • Trade Wars: Potential negative impacts of tariff escalations between countries like the US and China, leading to increased costs for consumers and economic disruptions. The article discusses concerns about a 25% tariff on Mexican and Canadian goods.
    • Inflation and Interest Rates: Fluctuations in inflation rates and the Federal Reserve’s monetary policies can impact commodity prices, like gold, and overall economic stability.
    • Supply Chain Disruptions: Factors like geopolitical tensions, regulatory hurdles, and labor shortages can delay key projects, such as natural gas supply projects.
    • Energy Market Volatility: Fluctuations in oil and natural gas prices can affect global markets and national economies.

    Saudi Arabia’s role:

    • Oil Production Management: Monitoring and potentially adjusting oil production levels through OPEC+ to balance the market and stabilize prices.
    • Energy Security: Contributing to global energy security by expanding natural gas supplies and partnering with other nations.

    7. What are the articles saying about the conflict between Israel and Palestine and what actions have been taken?

    The articles highlight tensions and ongoing issues related to the Israel-Palestine conflict:

    • Restrictions at Al-Aqsa Mosque: Imposing restrictions on Muslim worshippers during Ramadan at the Al-Aqsa Mosque, sparking concerns.
    • Displacement of Palestinians: Reports of Israeli military actions leading to the potential displacement of Palestinian families in the West Bank.
    • Peace Efforts: There are ceasefire agreements mentioned, and discussions are taking place regarding prisoner exchanges between Israel and Hamas.

    8. How is Saudi Arabia working to improve its workforce, including its government sector?

    Saudi Arabia is working to improve its workforce by:

    • “Golden Handshake” Program: Implementing programs like the “Golden Handshake” to incentivize voluntary resignation of less qualified or redundant government employees, providing them with generous severance packages.
    • Skills Development: Emphasizing skills re-training for employees and preventing the loss of institutional knowledge.
    • Retirement System Improvements: Improving retirement systems to provide better benefits and incentives for employees.
    • Nationalization of Jobs: Developing programs to encourage and enable Saudi citizens to participate and work at all levels.

    Kingdom of Saudi Arabia: Governance, Development, and Global Role

    Here’s a discussion of the Kingdom of Saudi Arabia, based on the provided sources:

    • The Kingdom’s leadership: The Custodian of the Two Holy Mosques, King Salman bin Abdulaziz Al Saud, and Crown Prince Mohammed bin Salman are mentioned for their continuous support in various sectors, including education and humanitarian efforts.
    • Service to pilgrims: The Kingdom is recognized for its dedication to serving pilgrims and visitors to the Two Holy Mosques, a tradition upheld by Saudi monarchs since the Kingdom’s unification.
    • Development projects: Visionary projects like NEOM are underway, reflecting the Kingdom’s ambition to provide solutions to global challenges and diversify its economy beyond oil.
    • Humanitarian efforts: The Kingdom continues to support humanitarian initiatives, as exemplified by providing housing for deserving families.
    • Cultural and religious significance: The Ministry of Culture organizes events during Ramadan to celebrate customs and traditions, enhance cultural awareness, and promote social values rooted in the Kingdom’s heritage. The kingdom emphasizes the importance of taking advantage of Ramadan to practice different forms of worship.
    • Economic diversification: The Kingdom is focused on diversifying its economy and is working towards achieving a transformation in the energy sector to address global environmental challenges.
    • Efforts to combat begging: The Kingdom is undertaking efforts to reduce begging through awareness campaigns and by directing alms to deserving recipients through official channels like the “Ehsan” platform.
    • National identity: The Kingdom’s flag symbolizes its foundation on monotheism, justice, and strong ethics.
    • Commitment to justice and equality: Since its establishment, the Kingdom has been based on justice and equality.
    • Ongoing development and improvement: The “My City” application is used to improve municipal services, with citizens and residents able to report issues.
    • The Kingdom rejects forming a parallel government in Sudan and affirms its support for the Republic of Sudan.

    Natural Gas: Global Demand and NEOM’s Energy Transformation

    Here’s a discussion of natural gas, based on the provided sources:

    • Global demand: The sources indicate that there is a rising global demand for natural gas, with an expected increase of 60% by 2040.
    • NEOM: The city of NEOM is a large development project in Saudi Arabia that is working towards a transformation in the energy sector. This transformation seeks to address global environmental challenges.

    Financial Executions, Zakat, Begging, and Charity

    Based on the provided sources, here’s a discussion of financial executions:

    • Golden Handshake The “Golden Handshake” program is designed to reduce financial obligations and eliminate unnecessary positions in the service sectors.
    • Benefits of the “Golden Handshake” Government employees benefit from financial incentives and training opportunities.
    • Impact on Service Sectors The “Golden Handshake” program is designed to reduce financial obligations and eliminate unnecessary positions in the service sectors.
    • Concerns with “Golden Handshake” The “Golden Handshake” program may cause long-term debt if the targeted jobholders have bank loans. The scheme may be entirely disrupted if their numbers were considerable, and as long as the program’s executive regulation has not been issued, assumptions are difficult.
    • Zakat Muslims are encouraged to pay Zakat during Ramadan to purify their money and help the poor. Islamic countries oversee the collection and distribution of Zakat to those in need during the fasting period.
    • Begging The sources discuss the exploitation of vulnerable groups such as women, children and the elderly by criminal networks to gain material advantages. There are psychological and social effects of begging on society. It is everyone’s moral responsibility to combat begging by reporting dubious incidents and supporting programs that restore the needy’s dignity through work rather than begging.
    • Charity Giving charity to non-deserving people is not just an economic mistake, but an injustice to those who are waiting for help.

    Economic Trade: Tariffs, Trade Wars, and Global Impact

    Here’s a discussion of economic trade, based on the provided sources:

    • Trade wars: A trade war’s problem is protecting local workers, but it ultimately harms them. Retaliatory tariffs increase the cost of exports, hurting companies and workers. The best way to limit the relocation of industries abroad is through negotiation and international cooperation.
    • Tariffs: If tariffs on goods from China, Canada, Mexico, and the European Union take effect, efforts to reduce inflation may be hindered.
    • Impact on specific sectors:
    • The United States relies on Mexico for fresh produce, so tariffs could negatively impact the cost of fruits and vegetables.
    • Increased tariffs on Chinese goods could lead to higher prices for electronics.
    • Increased tariffs on lumber and building materials could worsen the affordable housing crisis.
    • G20: Saudi Arabia plays a key role in the G20 through its economic decisions.

    Saudi League and Global Sports: Analysis and Highlights

    Here’s a discussion of sports leagues, based on the provided sources:

    • Saudi League: Multiple sources refer to the Saudi League.
    • Roshn Saudi League: Several sources mention the Roshn Saudi League. This may be the same as, or related to, the Saudi League.
    • The level of play in the Saudi League has improved.
    • The Saudi League is one of the strongest leagues.
    • The Saudi League attracts tourists from all over the world.
    • Key players:
    • Omar Al-Somah continues to write history in the Roshn Saudi League.
    • Toni scored a hat trick.
    • Riyad Mahrez played his best matches.
    • Al-Hilal: Al-Hilal continues to lead the league table in volleyball. There is a problem in Al-Hilal’s defense.
    • Specific Match Results:
    • Al-Fayha and Al-Wehda tied.
    • Al-Taawun and Al-Khulood won against Al-Fath and Al-Khaleej.
    • Al-Ittihad will host Al-Okhdood.
    • Al-Raed will face Al-Ettifaq.
    • Al-Riyadh will be a guest of Al-Qadisiyah.
    • FIFA is preparing to grant television stations a feature that allows them to use recordings taken by cameras worn by referees during the Club World Cup next summer.

    By Amjad Izhar
    Contact: amjad.izhar@gmail.com
    https://amjadizhar.blog

  • 45 Day Self-Improvement Handbook by A. V. Mendez

    45 Day Self-Improvement Handbook by A. V. Mendez

    The “45 Day Self-Improvement Handbook” is a guide offering daily ideas, habits, and action plans to enhance productivity, persuasion, self-confidence, and social skills. It is structured into four sections, each focusing on a specific challenge: productivity, persuasion, self-confidence, and social skills. Each of these challenges is broken down into daily tasks or suggestions to improve the specified area. The handbook suggests practical action for getting things done, and reflection to better yourself. It ends with a bonus section on the importance of physical health and energy.

    45-Day Self-Improvement Handbook: Study Guide & Glossary

    45-Day Self-Improvement Handbook: Study Guide

    Quiz

    Answer the following questions in 2-3 sentences each:

    1. What is the main goal of the “Challenge for Productivity” section (Days 1-10)?
    2. According to the handbook, what is one of the biggest distractions we have today?
    3. Explain the concept of “Time-Chunking.”
    4. Why is it important to prepare the tools needed for a task the day before?
    5. What does the handbook suggest you do to confront your fears?
    6. What does the author say about showing energy when trying to persuade someone?
    7. What does “WIFFM” stand for, and why is it important?
    8. What does the author suggest is the best way to become more confident?
    9. What is the “Law of Reciprocity,” and how can it be used for persuasion?
    10. Why is it important to acknowledge someone when they do a good job?

    Quiz Answer Key

    1. The main goal of the “Challenge for Productivity” section is to maximize your effectiveness and productivity while helping you avoid procrastination. It emphasizes identifying and minimizing time-wasting activities such as excessive social media use.
    2. According to the handbook, one of the biggest distractions we have today is being constantly online, with e-mail, Facebook, YouTube, and other desktop applications constantly displaying notifications. This constant stimulation fragments attention and hinders productivity.
    3. Time-Chunking is a method of working in chunks of time, typically involving 25-minute intervals of focused work followed by 5 minutes of rest, or alternatively, 40 minutes of work followed by 10 minutes of rest. It is used to help you stay focused and avoid exhaustion.
    4. Preparing the tools needed for a task the day before makes it easier to get started and less likely to wander off to do something else. Having everything ready eliminates potential distractions and reinforces your commitment to the task at hand.
    5. The handbook suggests that you start by facing your smallest fears first, and then tackle fears that don’t have a big impact on your life. The point is to make it a process and to make the smallest commitment that you can do easily.
    6. When trying to persuade or influence someone, it is important to show the right energy for the setting. Being aware of the situation and acting accordingly by matching energy levels are the key.
    7. “WIFFM” stands for “What’s In It For Me?” It is important because when trying to persuade someone, you need to think about what the other person wants and what the emotional benefits are for the other person.
    8. The author suggests that the best way to become more confident is by knowing what you’re good at and doing what you do well. Being great at what you do becomes the foundation for your confidence.
    9. The “Law of Reciprocity” states that when someone does something for us, we have a strong urge or motivation to do something back in return. It can be used for persuasion by offering something valuable to someone else, making them more likely to fulfill your request in the future.
    10. Acknowledging someone when they do a good job is important because it makes them feel noticed and uplifts them. It is an easy way to build trust, strengthen relationships, and encourage positive behavior.

    Essay Questions

    1. Discuss the relative importance of the four sections of the book, arguing which section is the most important or impactful, and why.
    2. Analyze the connection between productivity and self-confidence as presented in the handbook. How does improving one affect the other?
    3. Compare and contrast the ideas of “perfectionism” and “momentum” as presented in the handbook. How can these two concepts either help or hinder self-improvement efforts?
    4. Evaluate the effectiveness of the “Action Guide” prompts at the end of each section. How helpful are these prompts in applying the concepts discussed?
    5. To what degree does the author acknowledge the differences between introverted and extroverted personalities and tendencies? Are the recommendations within the text applicable for introverts and extroverts alike?

    Glossary of Key Terms

    • Productivity: The effectiveness of productive effort, especially in industry, as measured in terms of the rate of output per unit of input.
    • Procrastination: The action of delaying or postponing something.
    • Time-Chunking: A method of breaking down work into small, manageable intervals to improve focus and productivity.
    • Perfectionism: The refusal to accept any standard short of perfection.
    • Influence: The capacity to have an effect on the character, development, or behavior of someone or something.
    • Persuasion: The action or process of persuading someone or of being persuaded to do or believe something.
    • Law of Reciprocity: A social norm where people tend to reciprocate actions made toward them.
    • Self-Confidence: A feeling of trust in one’s abilities, qualities, and judgment.
    • Body Language: The process of communicating nonverbally through conscious or unconscious gestures and movements.
    • WIFFM (What’s In It For Me?): The underlying question of a consumer that must be answered before they consider your product or service.

    45 Day Self-Improvement Handbook: A Practical Guide

    Okay, here is a briefing document summarizing the main themes and important ideas from the provided excerpts of “45 Day Self-Improvement Handbook: 45 Daily Ideas, Habits, and Action-Plan for Becoming More Productive, Persuasive, Influential, Sociable and Self-Confident” by A.V. Mendez:

    Briefing Document: 45 Day Self-Improvement Handbook

    Document Title: 45 Day Self-Improvement Handbook: 45 Daily Ideas, Habits, and Action-Plan for Becoming More Productive, Persuasive, Influential, Sociable and Self-Confident Author: A.V. Mendez Date: Provided excerpts dated 20/02/2023

    Overview:

    This handbook outlines a 45-day program focused on self-improvement, broken down into four sections: productivity, persuasion and influence, self-confidence, and social skills. The core approach emphasizes small, consistent actions, habit building, and practical application of ideas. The document is action-oriented, providing specific steps and guidance to help the reader implement changes.

    Key Themes and Ideas:

    • Incremental Improvement & Action-Orientation: The handbook emphasizes the importance of taking action, even if it’s imperfect. “Getting things done is better than not doing stuff in the first place.” The document encourages immediate implementation of small, easy-to-do actions. It discourages overthinking and excessive planning before starting. For example, “Do not get bogged down by the details. Just apply your idea fast.”
    • Productivity Focus (Days 1-10): This section focuses on maximizing effectiveness and productivity and avoiding procrastination. Key ideas include:
    • Combating distractions, particularly those online.
    • Learning to say “no” to requests that take up time.
    • “Time Chunking” to focus on specific tasks with breaks.
    • Eliminating perfectionism: “Aim for progress instead. Aim for getting better every single day.”
    • Streamlining To-Do Lists: Prioritize tasks and schedule repetitive tasks.
    • Optimizing the Environment: Factors like light, noise, and temperature.
    • Process maps: Outsource certain tasks or take steps to streamline a process.
    • Preparing the tools you will need for tomorrow’s task.
    • “Taking Out The Trash”: Tackling nagging personal issues promptly.
    • Persuasion and Influence (Days 11-20): This section emphasizes the importance of influence, teaching and adding value to others. Key ideas include:
    • Influence is not about manipulation. It’s about pointing someone on the right direction.
    • Ask rather than not ask.
    • Reciprocity is important in persuasion.
    • Become an authority on your subject.
    • Cultivating a reputation or legend.
    • Identifying “WIIFM” (What’s In It For Me) for the person you are trying to persuade.
    • Self-Confidence (Days 21-33): This section addresses self-confidence as a skill that can be developed. Key ideas include:
    • Acknowledge the truth and be honest about where you are.
    • Owning your skills and working to improve on them.
    • Look at past accomplishments to build confidence.
    • Eliminate ego.
    • Ask good questions and help others improve their self-esteem.
    • Manage highs and lows and celebrate wins.
    • Personal hygiene and dressing appropriately.
    • Build momentum.
    • Surround yourself with good people.
    • Face fears in small steps.
    • Set small targets.
    • Set a big target and go small.
    • Social Skills (Days 34-45): This section addresses the ability to work with other people. Key ideas include:
    • The right people will help you meet your goals.
    • Use the right insider words or terminology to speak to the right audience.
    • The right body language.
    • Acknowledge peers.
    • Downplay mistakes.
    • Listen.
    • Take notes during conversation.
    • Encourage other people.
    • Say their name.
    • No bragging.
    • Introverts can speak too.
    • The magic of saying thank you.
    • Physical Fitness & Energy: Improving yourself includes making sure you are physically fit and energetic.
    • The “Stonecutter’s Credo”: The handbook concludes with the idea of persistence, comparing self-improvement to a stonecutter patiently hammering away at a rock until it splits. “When nothing seems to help, I go and look at a stonecutter hammering away at his rock perhaps a hundred times without as much as a crack showing in it. Yet at the hundred and first blow, it will split in two, and I know it was not that blow that did it, but all that had gone before.”

    Target Audience:

    Individuals seeking practical, actionable advice on self-improvement in areas such as productivity, influence, self-confidence, and social skills.

    Actionable Takeaways:

    • Focus on taking small, consistent actions to achieve larger goals.
    • Prioritize productivity by minimizing distractions and maximizing focus.
    • Build influence by adding value to others.
    • Develop self-confidence by acknowledging your strengths and accomplishments and working to improve your weaknesses.
    • Improve social skills by working with the right people and using the right language and body language.

    This briefing document provides a concise overview of the “45 Day Self-Improvement Handbook” excerpts and highlights its core principles and actionable advice.

    45-Day Self-Improvement Handbook: A Practical Guide

    FAQ: 45 Day Self-Improvement Handbook

    • What is the core idea behind the 45-Day Self-Improvement Handbook?
    • The handbook revolves around the idea of gradual and consistent self-improvement. It’s based on the concept that significant personal growth can be achieved by incorporating daily ideas, habits, and action plans into one’s life, focusing on areas such as productivity, persuasion, self-confidence, and social skills. It suggests breaking down larger goals into smaller, manageable steps, and building habits through consistent action. The process emphasizes learning, adapting, and building momentum over perfection.
    • How does the handbook approach productivity?
    • The handbook suggests a practical and action-oriented approach to productivity. It focuses on optimizing effectiveness by taking small steps, avoiding procrastination and minimizing distractions from things like social media. It advocates for identifying and prioritizing the most impactful tasks, breaking down work into manageable “time chunks” with scheduled rest, and simply getting started by doing instead of overthinking.
    • What techniques does the handbook propose for improving persuasion and influence?
    • The handbook views influence as guiding people in the right direction with good intentions, not manipulating them. Key techniques include asking for what you desire, acknowledging the other party’s point of view, and teaching others what you know. It also emphasizes the “Law of Reciprocity,” suggesting you provide something of value to others to increase the likelihood of them accepting your requests. Creating content and building authority are also strategies suggested for influence.
    • How does the handbook define and address self-confidence?
    • The handbook defines self-confidence as the ability to recognize what you’re capable of based on evidence. It is about having a belief in yourself based on reality. It discourages ego, which is based on thinking you are better than everyone else. It suggests several ways to build it, including acknowledging the truth about yourself, “owning your stuff” (improving what you are good at), looking at your track record of achievements, and setting small targets to build momentum. Eliminating ego is crucial.
    • What strategies does the handbook offer for improving social skills?
    • The handbook approaches social skills by addressing body language, active listening, using the right terms within your industry, and acknowledging your peers. It emphasizes understanding your audience’s needs, making a good first impression through appropriate dress, and being genuine in your interactions.
    • What does the handbook advise regarding dealing with perfectionism?
    • The handbook strongly advises against perfectionism. It emphasizes the importance of action over striving for unattainable flawlessness. The “F*ck Perfectionism” principle suggests aiming for progress and getting better every day, rather than waiting for the perfect moment or outcome. It encourages taking action, even if imperfect, as this leads to more progress than inaction.
    • How does the handbook suggest managing distractions, particularly online distractions?
    • The handbook recognizes that online distractions such as social media can significantly hinder productivity. It suggests scheduling dedicated “distraction time” to browse social media and other non-productive sites, rather than fighting the urge constantly and losing focus on current tasks. Disconnecting from the internet while working and using tools to block out noise and distractions are also encouraged.
    • What role does personal environment play in self-improvement according to the handbook?
    • The handbook emphasizes the importance of a conducive personal environment for enhancing productivity and motivation. It suggests optimizing things like lighting, noise level (using noise-cancelling headphones), and temperature to create a comfortable and focused workspace. Preparing tasks and tools the night before is also suggested to minimize distractions and facilitate getting started in the morning.

    45 Day Self-Improvement Handbook: Productivity, Persuasion, and More

    The “45 Day Self-Improvement Handbook” contains daily ideas, habits, and action plans for becoming more productive, persuasive, influential, sociable, and self-confident. The handbook is divided into sections that include:

    • Productivity (Day 1-10)
    • Persuasion and Influence (Day 11-20)
    • Self-Confidence (Day 21-33)
    • Social Skills (Day 34-45)

    The handbook suggests different ways to improve including:

    • Getting things done by not thinking too much about them.
    • Saying no to requests.
    • Using time chunking.
    • Aiming for progress instead of perfection.
    • Creating to-do lists.
    • Optimizing your environment.
    • Scheduling time for distractions.
    • Creating process maps.
    • Preparing the tasks that you need to finish on the next day.
    • Taking care of nagging personal issues.
    • Being aware of your own feelings.
    • Using the power of body language.
    • Acknowledging the truth about yourself.
    • Improving your skills.
    • Looking at your track record.
    • Eliminating your ego.
    • Asking good questions.
    • Managing your highs and lows.
    • Practicing personal hygiene.
    • Dressing to impress.
    • Building momentum.
    • Surrounding yourself with good people.
    • Facing your fears.
    • Setting a small target.
    • Hitting a big target by starting small.
    • Finding the right people to talk to and knowing your goal.
    • Using the right words.
    • Acknowledging peers.
    • Downplaying mistakes.
    • Listening.
    • Taking notes.
    • Encouraging other people.
    • Saying people’s names.
    • Avoiding bragging.
    • Saying thank you.

    45 Day Self-Improvement Handbook: Productivity, Persuasion, and Social Skills

    The “45 Day Self-Improvement Handbook” focuses on daily ideas and habits to foster self-improvement in productivity, persuasion, self-confidence and social skills. Here are some of the ideas:

    • Productivity: The handbook advises to not overthink tasks, say no to requests, use time chunking, aim for progress over perfection, create to-do lists, optimize your environment by adjusting noise, lighting, and temperature, schedule time for online distractions, create process maps, prepare tasks the day before, and address nagging personal issues.
    • Persuasion and Influence: To be more persuasive and influential, the handbook suggests to ask for what you want, give to others, become a “celebrity” in your market by creating content, teach others by sharing your knowledge, and cultivate a legend by controlling your narrative. When trying to persuade or influence someone, focus on what you can offer and what the other person wants. Also, show energy by reacting appropriately to a situation.
    • Self-Confidence: To improve self-confidence, the handbook recommends acknowledging your feelings and the truth about yourself, improving your skills, looking at your track record, eliminating your ego, asking good questions, managing highs and lows, practicing personal hygiene, and dressing to impress. Build momentum and surround yourself with supportive people.
    • Social Skills: To improve social skills, the handbook suggests to face your fears, set small targets, hit big targets by starting small, find the right people to talk to and know your goal, use the right words, use body language, acknowledge peers, downplay mistakes, listen, take notes, encourage others, say people’s names, avoid bragging, say thank you, and understand that even introverts can improve their social skills.

    45 Day Handbook: Productivity Guide

    The “45 Day Self-Improvement Handbook” includes a section that is dedicated to productivity, called “The Challenge for Productivity (Day 1-10)”. The goal of this section is to help maximize effectiveness and productivity, and help avoid procrastination.

    To improve productivity, the handbook advises the following:

    • Do not overthink tasks. Getting things done is about the speed of implementation.
    • Say no to requests. You can politely decline by responding in a way that does not make them feel bad.
    • Use time chunking. Time chunking is working in chunks of time, for example, 25 minutes, then resting for 5 minutes.
    • Aim for progress instead of perfection. Aim for getting better every day.
    • Create to-do lists. Personally making to-do lists can make you feel like you’re accomplishing the tasks you’re supposed to be doing.
    • Optimize your environment. Adjust things like noise, lighting, and temperature.
    • Schedule time for distractions. Schedule time for mindless tasks like browsing social media.
    • Create process maps. Process maps are written steps on how to achieve a specific task that you normally do every day.
    • Prepare tasks the day before. Prepare the tasks that you need to finish on the next day, which makes getting started easier.
    • Address nagging personal issues. Take care of nagging personal issues you haven’t taken care of.

    45 Day Self-Improvement Handbook: Personal Hygiene

    The “45 Day Self-Improvement Handbook” includes personal hygiene as a means to improve self-confidence. Having a clean physical appearance can make one more confident.

    The basics of personal hygiene include:

    • Hair
    • Face
    • Body
    • Nails
    • Teeth

    The handbook advises the following for taking care of yourself:

    • Cut your hair every 3-4 weeks and find the best haircut for your head shape.
    • Wash your face twice a day, preferably once in the morning and once before you sleep.
    • Use soap that smells good and use a light perfume on your body, and always use deodorant no matter where you are going.
    • Cut your nails at least once a week.
    • Brush your teeth for 2-3 minutes, 2-3 times a day and use an electric toothbrush if you can.

    45 Day Self-Improvement Handbook: Facing Your Fears

    The “45 Day Self-Improvement Handbook” suggests facing your fears as a way to improve your social skills. Facing your fears can be nerve-racking, but it has many benefits that will change your life. Many people never face their fears because they are afraid of failure.

    Here is how you can face your fears, according to the handbook:

    • Start with your smallest fears.
    • Start with fears that don’t have a big impact on your life.
    • Make a list and start facing the smallest one you can beat.

    The point is to make it a process and make the commitment small enough that you can do it easily. Remember that “Rome wasn’t built in a day”.

    By Amjad Izhar
    Contact: amjad.izhar@gmail.com
    https://amjadizhar.blog

  • SQL Fundamentals: Querying, Filtering, and Aggregating Data

    SQL Fundamentals: Querying, Filtering, and Aggregating Data

    The text is a tutorial on SQL, a language for managing and querying data. It highlights the fundamental differences between SQL and spreadsheets, emphasizing the organized structure of data in tables with defined schemas and relationships. The tutorial introduces core SQL concepts like statements, clauses (SELECT, FROM, WHERE), and the logical order of operations. It explains how to retrieve and filter data, perform calculations, aggregate results (SUM, COUNT, AVERAGE), and use window functions for more complex data manipulation without altering the data’s structure. The material also covers advanced techniques such as subqueries, Common Table Expressions (CTEs), and joins to combine data from multiple tables. The tutorial emphasizes the importance of Boolean algebra and provides practical exercises to reinforce learning.

    SQL Study Guide

    Review of Core Concepts

    This study guide focuses on the following key areas:

    • BigQuery Data Organization: How data is structured within BigQuery (Projects, Datasets, Tables).
    • SQL Fundamentals: Basic SQL syntax, clauses (SELECT, FROM, WHERE, GROUP BY, HAVING, ORDER BY, LIMIT).
    • Data Types and Schemas: Understanding data types and how they influence operations.
    • Logical Order of Operations: The sequence in which SQL operations are executed.
    • Boolean Algebra: Using logical operators (AND, OR, NOT) and truth tables.
    • Set Operations: Combining data using UNION, INTERSECT, EXCEPT.
    • CASE Statements: Conditional logic for data transformation.
    • Subqueries: Nested queries and their correlation.
    • JOIN Operations: Combining tables (INNER, LEFT, RIGHT, FULL OUTER).
    • GROUP BY and Aggregations: Summarizing data using aggregate functions (SUM, AVG, COUNT, MIN, MAX).
    • HAVING Clause: Filtering aggregated data.
    • Window Functions: Performing calculations across rows without changing the table’s structure (OVER, PARTITION BY, ORDER BY, ROWS BETWEEN).
    • Numbering Functions: Ranking and numbering rows (ROW_NUMBER, RANK, DENSE_RANK, NTILE).
    • Date and Time Functions: Extracting and manipulating date and time components.
    • Common Table Expressions (CTEs): Defining temporary result sets for complex queries.

    Quiz

    Answer each question in 2-3 sentences.

    1. Explain the relationship between projects, datasets, and tables in BigQuery.
    2. What is a SQL clause and can you provide three examples?
    3. Why is it important to understand data types when working with SQL?
    4. Describe the logical order of operations in SQL.
    5. Explain the purpose of Boolean algebra in SQL.
    6. Describe the difference between UNION, INTERSECT, and EXCEPT set operators.
    7. What is a CASE statement, and how is it used in SQL?
    8. Explain the difference between correlated and uncorrelated subqueries.
    9. Compare and contrast INNER JOIN, LEFT JOIN, and FULL OUTER JOIN.
    10. Explain the fundamental difference between GROUP BY aggregations and WINDOW functions.

    Quiz Answer Key

    1. BigQuery organizes data hierarchically, with projects acting as top-level containers, datasets serving as folders for tables within a project, and tables storing the actual data in rows and columns. Datasets organize tables, while projects organize datasets, offering a structured way to manage and access data.
    2. A SQL clause is a building block that makes up a complete SQL statement, defining specific actions or conditions. Examples include the SELECT clause to choose columns, the FROM clause to specify the table, and the WHERE clause to filter rows.
    3. Understanding data types is crucial because it dictates the types of operations that can be performed on a column and determines how data is stored and manipulated, and it also avoids errors and ensures accurate results.
    4. The logical order of operations determines the sequence in which SQL clauses are executed, starting with FROM, then WHERE, GROUP BY, HAVING, SELECT, ORDER BY, and finally LIMIT, impacting the query’s outcome.
    5. Boolean algebra allows for complex filtering and conditional logic within WHERE clauses using AND, OR, and NOT operators to specify precise conditions for row selection based on truth values.
    6. UNION combines the results of two or more queries into a single result set, INTERSECT returns only the rows that are common to all input queries, and EXCEPT returns the rows from the first query that are not present in the second query.
    7. A CASE statement allows for conditional logic within a SQL query, enabling you to define different outputs based on specified conditions, similar to an “if-then-else” structure.
    8. A correlated subquery depends on the outer query, executing once for each row processed, while an uncorrelated subquery is independent and executes only once, providing a constant value to the outer query.
    9. INNER JOIN returns only matching rows from both tables, LEFT JOIN returns all rows from the left table and matching rows from the right, filling in NULL for non-matches, while FULL OUTER JOIN returns all rows from both tables, filling in NULL where there are no matches.
    10. GROUP BY aggregations collapse multiple rows into a single row based on grouped values, while window functions perform calculations across a set of table rows that are related to the current row without collapsing or grouping rows.

    Essay Questions

    1. Discuss the importance of understanding the logical order of operations in SQL when writing complex queries. Provide examples of how misunderstanding this order can lead to unexpected results.
    2. Explain the different types of JOIN operations available in SQL, providing scenarios in which each type would be most appropriate. Illustrate with specific examples related to the course material.
    3. Describe the use of window functions in SQL. Include the purpose of PARTITION BY and ORDER BY. Explain some practical applications of these functions, emphasizing their ability to perform complex calculations without altering the structure of the table.
    4. Discuss the use of Common Table Expressions (CTEs) in SQL. How do they improve the readability and maintainability of complex queries? Provide an example of a query that benefits from the use of CTEs.
    5. Develop a SQL query using different levels of aggregations. Explain the query and explain its purpose.

    Glossary of Key Terms

    • Project (BigQuery): A top-level container for datasets and resources in BigQuery.
    • Dataset (BigQuery): A collection of tables within a BigQuery project, similar to a folder.
    • Table (SQL): A structured collection of data organized in rows and columns.
    • Schema (SQL): The structure of a table, including column names and data types.
    • Clause (SQL): A component of a SQL statement that performs a specific action (e.g., SELECT, FROM, WHERE).
    • Data Type (SQL): The type of data that a column can hold (e.g., INTEGER, VARCHAR, DATE).
    • Logical Order of Operations (SQL): The sequence in which SQL clauses are executed (FROM -> WHERE -> GROUP BY -> HAVING -> SELECT -> ORDER BY -> LIMIT).
    • Boolean Algebra: A system of logic dealing with true and false values, used in SQL for conditional filtering.
    • Set Operations (SQL): Operations that combine or compare result sets from multiple queries (UNION, INTERSECT, EXCEPT).
    • CASE Statement (SQL): A conditional expression that allows for different outputs based on specified conditions.
    • Subquery (SQL): A query nested inside another query.
    • Correlated Subquery (SQL): A subquery that depends on the outer query for its values.
    • Uncorrelated Subquery (SQL): A subquery that does not depend on the outer query.
    • JOIN (SQL): An operation that combines rows from two or more tables based on a related column.
    • INNER JOIN (SQL): Returns only matching rows from both tables.
    • LEFT JOIN (SQL): Returns all rows from the left table and matching rows from the right table.
    • RIGHT JOIN (SQL): Returns all rows from the right table and matching rows from the left table.
    • FULL OUTER JOIN (SQL): Returns all rows from both tables, matching or not.
    • GROUP BY (SQL): A clause that groups rows with the same values in specified columns.
    • Aggregation (SQL): A function that summarizes data (e.g., SUM, AVG, COUNT, MIN, MAX).
    • HAVING (SQL): A clause that filters aggregated data.
    • Window Function (SQL): A function that performs a calculation across a set of table rows that are related to the current row.
    • OVER (SQL): A clause that specifies the window for a window function.
    • PARTITION BY (SQL): A clause that divides the rows into partitions for window functions.
    • ORDER BY (SQL): A clause that specifies the order of rows within a window function.
    • ROWS BETWEEN (SQL): A clause that defines the boundaries of a window.
    • Numbering Functions (SQL): Window functions that assign numbers to rows based on specified criteria (ROW_NUMBER, RANK, DENSE_RANK, NTILE).
    • ROW_NUMBER() (SQL): Assigns a unique sequential integer to each row within a partition.
    • RANK() (SQL): Assigns a rank to each row within a partition based on the order of the rows. Rows with equal values receive the same rank, and the next rank is skipped.
    • DENSE_RANK() (SQL): Similar to RANK(), but assigns consecutive ranks without skipping.
    • NTILE(n) (SQL): Divides the rows within a partition into ‘n’ approximately equal groups, assigning a bucket number to each row.
    • Common Table Expression (CTE): A named temporary result set defined within a SELECT, INSERT, UPDATE, or DELETE statement.

    SQL and BigQuery: A Comprehensive Guide

    Okay, I will analyze the provided text excerpts and create a briefing document that summarizes the main themes, important ideas, and key facts related to SQL and BigQuery. I will include quotes from the original source where appropriate.

    Briefing Document: SQL and BigQuery Fundamentals

    Overview:

    This document summarizes key concepts and functionalities of SQL, specifically within the context of BigQuery. The material covers data organization, query structure, data manipulation, and advanced techniques like window functions and common table expressions. The focus is on understanding the logical order of operations within SQL queries and using this understanding to write efficient and effective code.

    1. Data Organization in BigQuery:

    • Tables: Data is stored in tables, which consist of rows and columns, similar to spreadsheets.
    • “Data in BigQuery and in SQL in general exists in the form of tables and a table looks just like this… it is a collection of rows and columns and it is quite similar to a spreadsheet…”
    • Datasets: Tables are organized into datasets, analogous to folders in a file system.
    • “In order to organize our tables we use data sets… a data set is just that it’s a collection of tables and it’s similar to how a folder works in a file system.”
    • Projects: Datasets belong to projects. BigQuery allows querying data from other projects, including public datasets.
    • “In BigQuery each data set belongs to a project… in Big Query I’m not limited to working with data that leaves in my project I could also from within my project query data that leaves in another project for example the bigquery public data is a project that is not mine…”

    2. Basic SQL Query Structure:

    • Statements: A complete SQL instruction, defining data retrieval and processing.
    • “This is a SQL statement it is like a complete sentence in the SQL language. The statement defines where we want to get our data from and how we want to receive these data including any processing that we want to apply to it…”
    • Clauses: Building blocks of SQL statements (e.g., SELECT, FROM, WHERE, GROUP BY, ORDER BY, LIMIT).
    • “The statement is made up of building block blocks which we call Clauses and in this statement we have a clause for every line… the Clauses that we see here are select from where Group by having order and limit…”
    • Importance of Data Types: Columns have defined data types which dictates the operations that can be performed. SQL tables can be clearly connected with each other.
    • “You create a table and when creating that table you define the schema the schema is the list of columns and their names and their data types you then insert data into this table and finally you have a way to define how the tables are connected with each other…”

    3. Key SQL Concepts:

    • Cost Consideration: BigQuery charges based on the amount of data scanned by a query. Monitoring query size is crucial.
    • “This query will process 1 kilobyte when run so this is very important because here big query is telling you how much data will be scanned in order to give you the results of this query… the amount of data that scanned by the query is the primary determinant of bigquery costs.”
    • Arithmetic Operations: SQL supports combining columns and constants using arithmetic operators and functions.
    • “We are able to combine columns and constants with any sort of arithmetic operations. Another very powerful thing that SQL can do is to apply functions and a function is a prepackaged piece of logic that you can apply to our data…”
    • Aliases: Using aliases (AS) to rename columns or tables for clarity and brevity.
    • Boolean Algebra in WHERE Clause: The WHERE clause uses Boolean logic (AND, OR, NOT) to filter rows based on conditions. Truth tables help understand operator behavior.
    • “The way that these logical statements work is through something called Boolean algebra which is an essential theory for working with SQL… though the name may sound a bit scary it is really easy to understand the fundamentals of Boolean algebra now…”
    • Set Operators (UNION, INTERSECT, EXCEPT): Combining the results of multiple queries using set operations. UNION combines rows, INTERSECT returns common rows, and EXCEPT returns rows present in the first table but not the second. UNION DISTINCT removes duplicate rows, while UNION ALL keeps them.
    • “This command is called Union and not like stack or or something else is is that this is a set terminology right this comes from the mathematical theory of sets… and unioning means combining the values of two sets…”

    4. Advanced SQL Techniques:

    • CASE WHEN Statements: Creating conditional logic to assign values based on specified conditions.
    • “When this condition is true we want to return the value low which is a string a piece of text that says low… all of this that you see here this is the case Clause right or the case statement and all of this is basically defining a new column in my table…”
    • Subqueries: Embedding queries within other queries to perform complex filtering or calculations. Correlated subqueries are slower as they need to be recomputed for each row.
    • “SQL solves this query first gets the result and then plugs that result back back into the original query to get the data we need… on the right we have something that’s called a correlated subquery and on the left we Define this as uncor related subquery…”
    • Common Table Expressions (CTEs): Defining temporary named result sets (tables) within a query for modularity and readability.
    • JOIN Operations: Combining data from multiple tables based on related columns. Types include INNER JOIN, LEFT JOIN, RIGHT JOIN, and FULL OUTER JOIN.
    • “A full outer join is like an inner join plus a left join plus a right join…”.
    • GROUP BY and Aggregation: Summarizing data by grouping rows based on one or more columns and applying aggregate functions (e.g., SUM, AVG, COUNT, MIN, MAX). The HAVING clause filters aggregated results.
    • “Having you are free to write filters on aggregated values regardless of the columns that you are selecting…”.
    • Window Functions: Performing calculations across a set of rows that are related to the current row without altering the table structure. They use the OVER() clause to define the window.
    • “Window functions allow us to do computations and aggregations on multiple rows in that sense they are similar to what we have seen with aggregations and group bu the fundamental difference between grouping and window function is that grouping is fundamentally altering the structure of the table…”
    • Numbering Functions (ROW_NUMBER, DENSE_RANK, RANK): Assigning sequential numbers or ranks to rows based on specified criteria.
    • “Numbering functions are functions that we use in order to number the rows in our data according to our needs and there are several numbering functions but the three most important ones are without any doubt row number dense Rank and rank…”

    5. Logical Order of SQL Operations:

    The excerpts emphasize the importance of understanding the order in which SQL operations are performed. This order dictates which operations can “see” the results of previous operations. The general order is:

    1. FROM (Source data)
    2. WHERE (Filter rows)
    3. GROUP BY (Aggregate into groups)
    4. Aggregate Functions (Calculate aggregations within groups)
    5. HAVING (Filter aggregated groups)
    6. Window Functions (Calculate windowed aggregates)
    7. SELECT (Choose columns and apply aliases)
    8. DISTINCT (Remove duplicate rows)
    9. UNION/INTERSECT/EXCEPT (Combine result sets)
    10. ORDER BY (Sort results)
    11. LIMIT (Restrict number of rows)

    6. Postgress SQL Quirk

    Integer Division: When dividing two integers postgress assumes that you you are doing integer Division and returns integer as well. To avoid it, at least one number needs to be floating point number.

    Conclusion:

    The provided text excerpts offer a comprehensive overview of SQL fundamentals and advanced techniques within BigQuery. A strong understanding of data organization, query structure, the logical order of operations, and the various functions and clauses available is crucial for writing efficient and effective SQL code. Mastering these concepts will enable users to extract valuable insights from their data and solve complex analytical problems.

    BigQuery and SQL: Data Management, Queries, and Functions

    FAQ on SQL and Data Management with BigQuery

    1. How is data organized in BigQuery and SQL in general?

    Data in BigQuery is organized in a hierarchical structure. At the lowest level, data resides in tables. Tables are collections of rows and columns, similar to spreadsheets. To organize tables, datasets are used, which are collections of tables, analogous to folders in a file system. Finally, datasets belong to projects, providing a top-level organizational unit. BigQuery also allows querying data from public projects, expanding access beyond a single project.

    2. How does BigQuery handle costs and data limits?

    BigQuery’s costs are primarily determined by the amount of data scanned by a query. Within the sandbox program, users can scan up to one terabyte of data each month for free. It’s important to check the amount of data that a query will process before running it, especially with large tables, to avoid unexpected charges. The query interface displays this information before execution.

    3. What are the fundamental differences between SQL tables and spreadsheets?

    While both spreadsheets and SQL tables store data in rows and columns, key differences exist. Spreadsheets are typically disconnected, whereas SQL provides mechanisms to define connections between tables. This allows relating data across multiple tables through defined schemas, specifying column names and data types. SQL also enforces a logical order of operations, which dictates the order in which the various parts of a query are executed.

    4. How are calculations and functions used in SQL queries?

    SQL allows performing calculations using columns and constants. Common arithmetic operations are supported, and functions, pre-packaged logic, can be applied to data. The order of operations in SQL follows standard arithmetic rules: brackets first, then functions, multiplication and division, and finally addition and subtraction.

    5. What are Clauses in SQL, and how are they used?

    SQL statements are constructed from building blocks known as Clauses. Key clauses include SELECT, FROM, WHERE, GROUP BY, HAVING, ORDER BY, and LIMIT. Clauses define where the data comes from, how it should be processed, and how the results should be presented. The clauses are assembled to form a complete SQL statement. The order in which you write the clauses is less important than the logical order in which they are executed, which is FROM, WHERE, GROUP BY, HAVING, SELECT, ORDER BY and LIMIT.

    6. How do the WHERE clause and Boolean algebra work together to filter data in SQL?

    The WHERE clause is used to filter rows based on logical conditions. These conditions rely on Boolean algebra, which uses operators like NOT, AND, and OR to create complex expressions. Understanding the order of operations within Boolean algebra is crucial for writing effective WHERE clauses. NOT is evaluated first, then AND, and finally OR.

    7. What are set operations in SQL, and how are they used?

    SQL provides set operations like UNION, INTERSECT, and EXCEPT to combine or compare the results of multiple queries. UNION combines rows from two or more tables, with UNION DISTINCT removing duplicate rows and UNION ALL keeping all rows, including duplicates. INTERSECT DISTINCT returns only the rows that are common to both tables. EXCEPT DISTINCT returns rows from the first table that are not present in the second table.

    8. How can window functions be used to perform calculations across rows without altering the structure of the table?

    Window functions perform calculations across a set of table rows related to the current row, without grouping the rows like GROUP BY. They are defined using the OVER() clause, which specifies the window of rows used for the calculation. Window functions can perform aggregations, ordering, and numbering within the defined window, adding insights without collapsing the table’s structure. Numbering functions include ROW_NUMBER, RANK, and DENSE_RANK. Numbering functions are often used in conjunction with Partition By and Order By which can divide data into logical partitions in which to number results. Ranking functions, when used with PARTITION BY and ORDER BY can define a rank, for instance, for each race result, ordered fastest to slowest. They can then be further filtered with use of a CTE, a Common Table Expression.

    SQL Data Types and Schemas

    In SQL, a data model is defined by the name of columns and the data type that each column will contain.

    • Definition: The schema of a table includes the name of each column in the table and the data type of each column. The data type of a column defines the type of operations that can be done to the column.
    • Examples of data types:
    • Integer: A whole number.
    • Float: A floating point number.
    • String: A piece of text.
    • Boolean: A value that is either true or false.
    • Timestamp: A value that represents a specific point in time.
    • Interval: A data type that specifies a certain span of time.
    • Data types and operations: Knowing the data types of columns is important because it allows you to know which operations can be applied. For example, you can perform mathematical operations such as multiplication or division on integers or floats. For strings, you can change the string to uppercase or lowercase. For timestamps, you can subtract a certain amount of time from that moment.

    SQL Tables: Structure, Schema, and Operations

    In SQL, data exists in the form of tables. Here’s what you need to know about SQL tables:

    • StructureA table is a collection of rows and columns, similar to a spreadsheet.
    • Each row represents an entry, and each column represents an attribute of that entry. For example, in a table of fantasy characters, each row may represent a character, and each column may represent information about them such as their ID, name, class, or level.
    • SchemaEach SQL table has a schema that defines the columns of the table and the data type of each column.
    • The schema is assumed as a given when working in SQL and is assumed not to change over time.
    • OrganizationIn SQL, tables are organized into data sets.
    • A data set is a collection of tables and is similar to a folder in a file system.
    • In BigQuery, each data set belongs to a project.
    • Table IDThe table ID represents the full address of the table.
    • The address is made up of three components: the ID of the project, the data set that contains the table, and the name of the table.
    • Connections between tablesSQL allows you to define connections between tables.
    • Tables can be connected with each other through arrows. These connections indicate that one of the tables contains a column with the same data as a column in another table, and that the tables can be joined using those columns to combine data.
    • Table operations and clausesFROM: indicates the table from which to retrieve data.
    • SELECT: specifies the columns to retrieve from the table.
    • WHERE: filters rows based on specified conditions.
    • DISTINCT: removes duplicate rows from the result set.
    • UNION: stacks the results from multiple tables.
    • ORDER BY: sorts the result set based on specified columns.
    • LIMIT: limits the number of rows returned by the query.
    • JOIN: combines rows from two or more tables based on a related column.
    • GROUP BY: groups rows with the same values in specified columns into summary rows.

    SQL Statements: Structure, Clauses, and Operations

    Here’s what the sources say about SQL statements:

    General Information

    • In SQL, a statement is like a complete sentence that defines where to get data and how to receive it, including any processing to apply.
    • A statement is made up of building blocks called clauses.
    • Query statements allow for retrieving, analyzing, and transforming data.
    • In this course, the focus is exclusively on query statements.

    Components and Structure

    • Clauses are assembled to build statements.
    • There is a specific order to writing clauses; writing them in the wrong order will result in an error.
    • Common clauses include SELECT, FROM, WHERE, GROUP BY, HAVING, ORDER BY, and LIMIT.

    Order of Execution

    • The order in which clauses are written (lexical order) is not the same as the order in which they are executed (logical order).
    • The logical order of execution is FROM, WHERE, GROUP BY, HAVING, SELECT, ORDER BY, and finally LIMIT.
    • The actual order of execution (effective order) may differ from the logical order due to optimizations made by the SQL engine. The course focuses on mastering the lexical order and the logical order.

    Clauses and their Function

    • FROM: Specifies the table from which to retrieve the data. It is always the first component in the logical order of operations because you need to source the data before you can work with it.
    • SELECT: Specifies which columns of the table to retrieve. It allows you to get any columns from the table in any order. You can also use it to rename columns, define constant columns, combine columns in calculations, and apply functions.
    • WHERE: Filters rows based on specified conditions. It follows right after the FROM clause in the logical order. The WHERE clause can reference columns of the tables, operations on columns, and combinations between columns.
    • DISTINCT: removes duplicate rows from the result set.

    Combining statements

    • UNION allows you to stack the results from two or more tables. In BigQuery, you must specify UNION ALL to include duplicate rows or UNION DISTINCT to only include unique rows.
    • INTERSECT returns only the rows that are shared between two tables.
    • EXCEPT returns all of the elements in one table except those that are shared with another table.
    • For UNION, INTERSECT, and EXCEPT, the tables must have the same number of columns, and the columns must have the same data types.

    Subqueries

    • Subqueries are nested queries used to perform complex tasks that cannot be done with a single query.
    • A subquery is a piece of SQL logic that returns a table.
    • Subqueries can be used in the FROM clause instead of a table name.

    Common Table Expressions (CTEs)

    • CTEs are virtual tables defined within a query that can be used to simplify complex queries and improve readability.
    • CTEs are defined using the WITH keyword, followed by the name of the table and the query that defines it.
    • CTEs can be used to build data pipelines within SQL code.

    SQL Logical Order of Operations

    Here’s what the sources say about the logical order of operations in SQL:

    Basics

    • The order in which clauses are written (lexical order) is not the order in which they are executed (logical order).
    • Understanding the logical order is crucial for accelerating learning SQL.
    • The logical order helps in building a powerful mental model of SQL that allows tackling complex and tricky problems.

    The Logical Order

    • The logical order of execution is: FROM, WHERE, GROUP BY, HAVING, SELECT, ORDER BY, and finally LIMIT.
    • The JOIN clause is not really separate from the FROM clause; they are the same component in the logical order of operations.

    Rules for Understanding the Schema

    • Operations are executed sequentially from left to right.
    • Each operation can only use data that was produced by operations that came before it.
    • Each operation cannot know anything about data that is produced by operations that follow it.

    Implications of the Logical Order

    • FROM is the very first component in the logical order of operations because the data must be sourced before it can be processed. The FROM clause specifies the table from which to retrieve the data. The JOIN clause is part of this step, as it defines how tables are combined to form the data source.
    • WHERE Clause follows right after the FROM Clause. After sourcing the data, the next logical step is to filter the rows that are not needed. The WHERE clause drops all the rows that are not needed, so the table becomes smaller and easier to deal with.
    • GROUP BY fundamentally alters the structure of the table. The GROUP BY operation compresses down the values; in the grouping field, a single row will appear for each distinct value, and in the aggregate field, the values will be compressed or squished down to a single value as well.
    • SELECT determines which columns to retrieve from the table. The SELECT clause is where new columns are defined.
    • ORDER BY sorts the result of the query. Because the ordering occurs so late in the process, SQL knows the final list of rows that will be included in the results, which is the right moment to order those rows.
    • LIMIT is the very last operation. After all the logic of the query is executed and all data is computed, the LIMIT clause restricts the number of rows that are output.

    Window Functions and the Logical Order

    • Window functions operate on the result of the GROUP BY clause, if present; otherwise, they operate on the data after the WHERE filter is applied.
    • After applying the window function, the SELECT clause is used to choose which columns to show and to label them.

    Common Errors

    • A common error is to try to use LIMIT to make a query cheaper. The LIMIT clause does not reduce the amount of data that is scanned; it only limits the number of rows that are returned.
    • Another common error is to violate the logical order of operations. For example, you cannot use a column alias defined in the SELECT clause in the WHERE clause because the WHERE clause is executed before the SELECT clause.
    • In Postgres, you cannot use the labels that you assign to aggregations in the HAVING clause.

    Boolean Algebra: Concepts, Operators, and SQL Application

    Here’s what the sources say about Boolean algebra:

    Basics

    • Boolean algebra is essential for working with SQL and other programming languages.
    • It is fundamental to how computers work.
    • It is a simple way to understand the fundamentals.

    Elements

    • In Boolean algebra, there are only two elements: true and false.
    • A Boolean field in SQL is a column that can only have these two values.

    Operators

    • Boolean algebra has operators that transform elements.
    • The three most important operators are NOT, AND, and OR.

    Operations and Truth Tables

    • In Boolean algebra, operations combine operators and elements and return elements.
    • To understand how a Boolean operator works, you have to look at its truth table.

    NOT Operator

    • The NOT operator works on a single element, such as NOT TRUE or NOT FALSE.
    • The negation of p is the opposite value.
    • NOT TRUE is FALSE
    • NOT FALSE is TRUE

    AND Operator

    • The AND operator connects two elements, such as TRUE AND FALSE.
    • If both elements are true, then the AND operator will return true; otherwise, it returns false.

    OR Operator

    • The OR operator combines two elements.
    • If at least one of the two elements is true, then the OR operator returns true; only if both elements are false does it return false.

    Order of Operations

    • There is an agreed-upon order of operations that helps solve complex expressions.
    • The order of operations is:
    1. Brackets (solve the innermost brackets first)
    2. NOT
    3. AND
    4. OR

    Application in SQL

    • A complex logical statement that is plugged into the WHERE filter isolates only certain rows.
    • SQL converts statements in the WHERE filter to true or false, using values from a row.
    • SQL uses Boolean algebra rules to compute a final result, which is either true or false.
    • If the result computes as true for the row, then the row is kept; otherwise, the row is discarded.

    Example

    To solve a complex expression, such as NOT (TRUE OR FALSE) AND (FALSE OR TRUE), proceed step by step:

    1. Solve the innermost brackets:
    • TRUE OR FALSE is TRUE
    • FALSE OR TRUE is TRUE
    1. The expression becomes: NOT (TRUE) AND (TRUE)
    2. Solve the NOT:
    • NOT (TRUE) is FALSE
    1. The expression becomes: FALSE AND TRUE
    2. Solve the AND:
    • FALSE AND TRUE is FALSE
    1. The final result is FALSE
    Intuitive SQL For Data Analytics – Tutorial
    Data Analytics FULL Course for Beginners to Pro in 29 HOURS – 2025 Edition

    The Original Text

    learn SQL for analytics Vlad is a data engineer and in this course he covers both the theory and the practice so you can confidently solve hard SQL challenges on your own no previous experience required and you’ll do everything in your browser using big query hi everyone my name is Vlad and I’m a date engineer welcome to intuitive SQL for analytics this here is the main web page for the course you will find it in the video description and this will get updated over time with links and resources so be sure to bookmark it now the goal of this course is to quickly enable you to use SQL to analyze and manipulate data this is arguably the most important use case for SQL and the Practical objective is that by the end of this course you should be able to confidently solve hard SQL problems of the kind that are suggested during data interviews the course assumes no previous knowledge of SQL or programming although it will be helpful if you’ve work with spreadsheets such as Microsoft Excel or Google Sheets because there’s a lot of analogies between manipulating data in spreadsheets and doing it in SQL and I also like to use spreadsheets to explain SQL Concepts now there are two parts to this course theory and practice the theory part is a series of short and sweet explainers about the fundamental concepts in SQL and for this part we will use Google bigquery bigquery which you can see here is a Google service that allows you to upload your own data and run SQL on top of it so in the course I will teach you how to do that and how to do it for free you won’t have to to spend anything and then we will load our data and we will run SQL code and besides this there will be drawings and we will also be working with spreadsheets and anything it takes to make the SQL Concepts as simple and understandable as possible the practice part involves doing SQL exercises and for this purpose I recommend this website postest SQL exercises this is a free and open-source website where you will find plenty of exercises and you will be able to run SQL code to solve these exercises check your answer and then see a suggested way to do it so I will encourage you to go here and attempt to solve these exercises on your own however I have also solved 42 of these exercises the most important ones and I have filmed explainers where I solve the exercise break it apart and then connect it to the concepts of the course so after you’ve attempted the exercise you will be able to see me solving it and connect it to the rest of the course so how should you take this course there are actually many ways to do it and you’re free to choose the one that works best if you are a total beginner I recommend doing the following you should watch the theory lectures and try to understand everything and then once you are ready you should attempt to do the exercises on your own on the exercise uh website that I’ve shown you here and if you get stuck or after you’re done you can Watch How I solved the exercise but like I said this is just a suggestion and uh you can combine theory and practice as you wish and for example a more aggressive way of doing this course would be to jump straight into the exercises and try to do them and every time that you are stuck you can actually go to my video and see how I solved the exercise and then if you struggle to understand the solution that means that maybe there’s a theoretical Gap and then you can go to the theory and see how the fundamental concepts work so feel free to experiment and find the way that works best for you now let us take a quick look at the syllabus for the course so one uh getting started this is a super short explainer on what SQL actually is and then I teach you how to set up bigquery the Google service where we will load our data and run SQL for the theory part the second uh chapter writing your first query so here I explained to you how big query works and how you can use it um and how you are able to take your own data and load it in big query so you can run SQL on top of it and at the end of it we finally run our first SQL query chapter 3 is about exploring some ESS IAL SQL Concepts so this is a short explainer of how data is organized in SQL how the SQL statement Works meaning how we write code in SQL and here is actually the most important concept of the whole course the order of SQL operations this is something that is not usually taught properly and a lot of beginners Miss and this causes a lot of trouble when you’re you’re trying to work with SQL so once you learn this from the start you will be empowered to progress much faster in your SQL knowledge and then finally we get into the meat of the course this is where we learn all the different components in SQL how they work and how to combine them together so this happens in a few phases in the first phase we look at the basic components of SQL so these are uh there’s a few of them uh there’s select and from uh there’s learning how to transform columns the wear filter the distinct Union order by limit and then finally we see how to do simple aggregations at the end of this part you will be empowered to do the first batch of exercises um don’t worry about the fact that there’s no links yet I will I will add them but this is basically involves going to this post SQL exercises website and going here and doing this uh first batch of exercises and like I said before after you’ve done the exercises you can watch the video of me also solving them and breaking them down next we take a look at complex queries and this involves learning about subqueries and Common Table expressions and then we look at joining tables so here is where we understand how SQL tables are connected uh with each other and how we can use different types of joints to bring them together and then you are ready for the second batch of exercises which are those that involve joints and subqueries and here there are eight exercises the next step is learning about aggregations in SQL so this involves the group bu the having and window functions and then finally you are ready for the final batch of exercises which actually bring together all the concepts that we’ve learned in this course and these are 22 exercises and like before for each exercise you have a video for me solving it and breaking it apart and then finally we have the conclusion in the conclusion we see how we can put all of this knowledge together and then we take a look at how to use this knowledge to actually go out there and solve SQL challenges such as the ones that are done in data interviews and then here you’ll find uh all the resources that are connected to the course so you have the files with our data you have the link to the spreadsheet that we will use the exercises and all the drawings that we will do this will definitely evolve over over time as the course evolves so bookmark this page and keep an eye on it that was that was all you needed to know to get started so I will see you in the course if you are working with SQL or you are planning to work with SQL you’re certainly a great company in the 2023 developer survey by stack Overflow there is a ranking of the most popular Technologies out there if we look at professional developers where we have almost 70,000 responses we can see that SQL is ranked as the third most popular technology SQL is certainly one of the most in demand skills out there not just for developers but for anyone who works with data in any capacity and in this course I’m going to help you learn SQL the way I wish I would have learned it when I started out on my journey since this is a practical course we won’t go too deep into the theory all you need to know for our purposes is that SQL is a language for working with data like most languages SQL has several dialects you may have heard of post SQL or my sqil for example you don’t need to worry about these dialects because they’re all very similar so if you learn SQL in any one of the dialects you’ll do well on all the others in this course we will be working with B query and thus we will write SQL in the Google SQL dialect here is the documentation for Google big query the service that we will use to write SQL code in this course you can see that big query uses Google SQL a dialect of SQL which is an compliant an compliant means that Google SQL respects the generally recognized standard for creating SQL dialects and so it is highly compatible with with all other common SQL dialects as you can read here Google SQL supports many types of statements and statements are the building blocks that we use in order to get work done with SQL and there are several types of statements listed here for example query statements allow us to retrieve and analyze and transform data data definition language statements allow us to create and modify database objects such as tables and Views whereas data manipulation language statements allows us to update and insert and delete data from our tables now in this course we focus exclusively on query statements statements that allow us to retrieve and process data and the reason for this is that if you’re going to start working with big query you will most likely start working with this family of statements furthermore query statements are in a sense the foundation for all other families of statements so if you understand uh query statements you’ll have no trouble learning the others on your own why did I pick big query for this course I believe that the best way to learn is to load your own data and follow questions that interest you and play around with your own projects and P query is a great tool to do just that first of all it is free at least for the purposes of learning and for the purposes of this course it has a great interface that will give you U really good insights into your data and most importantly it is really easy to get started you don’t have to install anything on your computer you don’t have to deal with complex software you just sign up for Google cloud and you’re ready to go and finally as you will see next big query gives you many ways to load your own data easily and quickly and get started writing SQL right away I will now show you how you can sign up for Google cloud and get started with bigquery so it all starts with this link which I will share in the resources and this is the homepage of Google cloud and if you don’t have an account with Google Cloud you can go here and select sign in and here you need to sign in with your Google account which you probably have but if you don’t you can go here and select create account so I have now signed in with my Google account which you can see here in the upper right corner and now I get a button that says start free so I’m going to click that and now I get taken to this page and on the right you see that the first time you sign up for Google Cloud you get $300 of free credits so that you can try the services and that’s pretty neat and here I have to enter some extra information about myself so I will keep it as is and agree to the terms of service and continue finally I need to do the payment information verification so unfortunately this is something I need to do even though I’m not going to be charged for the services and this is for Google to be able to verify my my identity so I will pick individual as account type and insert my address and finally I need to add a payment method and again uh I need to do this even though I’m not going to pay I will actually not do it here because I don’t intend to sign up but after you are done you can click Start my free trial and then you should be good to go now your interface may look a bit different but essentially after you’ve signed up for Google Cloud you will need to create a project and the project is a tool that organizes all your work in Google cloud and essentially every work that you do in Google cloud has to happen inside a specific project now as you can see here there is a limited quota of projects but that’s not an issue because we will only need one project to work in this course and of course creating a new project is totally free so I will go ahead and give it a name and I don’t need any organization and I will simply click on create once that’s done I can go back back to the homepage for Google cloud and here as you can see I can select a project and here I find the project that I have created before and once I select it the rest of the page won’t change but you will see the name of the project in the upper bar here now although I’ve created this project as an example for you for the rest of the course you will see me working within this other project which was the one that I had originally now I will show you how you can avoid paying for Google cloud services if you don’t want to so from the homepage you have the search bar over here and you can go here and write billing and click payment overview to go to the billing service now here on the left you will see your billing account account which could be called like this or have another name and clicking here I can go to manage billing accounts now here I can go to my projects Tab and I see a list of all of my projects in Google cloud and a project might or might not be connected to a billing account if a project is not connected to a billing account then then Google won’t be able to charge you for this project although keep in mind that if you link your project with a billing account and then you incur some expenses if you then remove the billing account you will still owe Google Cloud for those uh expenses so what I can do here is go to my projects and on actions I can select disabled building in case I have a billing account connected now while this is probably the shest way to avoid incurring any charges you will see that you will be severely limited in what you can do in your project if that project is not linked to any billing account however you should still be able to do most of what you need to do in B query at least for this course and we can get more insight into how that works by by going to the big query pricing table so this page gives us an overview of how pricing works for big query I will not analyze this in depth but what you need to know is that when you work with bigquery you can fundamentally be charged for two things one is compute pricing and this basically means all the data that bigquery scans in order to return the results that you need when you write your query and then you have storage pricing which is the what you pay in order to store your data inside bigquery now if I click on compute pricing I will go to the pricing table and here you can select the region that uh most reflects where you are located and I have selected Europe here and as you can see you are charged $625 at the time of this video for scanning a terabyte of data however the first terabyte per month is free so every month you can write queries that scan one terabyte of data and not pay for them and as you will see more in detail this is more than enough for what we will be doing in this course and also for for what you’ll be doing on your own in order to experiment with SQL and if I go back to the top of the page and then click on storage pricing you can see here that again you can select your region and see um several pricing uh units but here you can see that the first 10 gab of storage per month is free so you can put up to 10 gigabytes of data in B query and you won’t need a billing account you won’t pay for storage and this is more than enough for our needs in order to learn SQL in short bigquery gives us a pretty generous free allowance for us to load data and play with it and we should be fine however I do urge you to come back to this page and read it again because things may have changed since I recorded this video video to summarize go to the billing service check out your billing account and you have the option to decouple your project from the billing account to avoid incurring any charges and you should still be able to use B query but as a disclaimer I cannot guarantee that things will work just the same uh at the time that you are watching this video so be sure to check the documentation or maybe discuss with Google Cloud support to um avoid incurring any unexpected expenses please do your research and be careful in your usage of these services for this course I have created an imaginary data set with the help of chat GPT the data set is about a group of fantasy characters as well as their items and inventories I then proceed proed to load this data into bigquery which is our SQL system I also loaded it into Google Sheets which is a spreadsheet system similar to Microsoft Excel this will allow me to manipulate the data visually and help you develop a strong intuition about SQL operations I’m going to link a separate video which explains how you can also use chat PT to generate imaginary data according to your needs and then load this data in Google Sheets or bigquery I will also link the files for this data in the description which you can use to reproduce this data on your side next I will show you how we can load the data for this course into bigquery so I’m on the homepage of Google cloud and I have a search bar up here and I can write big query and select it from here and this will take me to the big query page now there is a panel on the left side that appears here if I hover or it could be fixed and this is showing you several tools that you can use within bigquery and you can see that we are in the SQL workspace and this is actually the only tool that we will need for this course so if you if you’re seeing this panel on the left I recommend going to this arrow in the upper left corner and clicking it so you can disable it and make more room for yourself now I want to draw your attention to the Explorer tab which shows us where our data is and how it is organized so I’m going to expand it here now data in bigquery and in SQL in general exists in the form of tables and a table looks just like this as you can see here the customer’s table it is a collection of rows and columns and it is quite similar to a spreadsheet so this will be familiar to you if you’ve ever worked with Microsoft Excel or Google Sheets or any spreadsheet program so your data is actually living in a table and you could have as many tables as you need in B query there could be quite a lot of them so in order to organize our tables we use data sets for example in this case my data is a data set which contains the table customers and employee data and a data set is is just that it’s a collection of tables and it’s similar to how a folder Works in a file setem system it is like a for folder for tables finally in bigquery each data set belongs to a project so you can see here that we have two data sets SQL course and my data and they both belong to this project idelic physics and so on and this is actually the ID of my project this is the ID of the project that I’m working in right now the reason the Explorer tab shows the project as well is that in big query I’m not limited to working with data that leaves in my project I could also from within my project query data that leaves in another project for example the bigquery public data is a project that is not mine but it’s actually a public project by bigquery and if I expand this you will see that it contains a collection of of several data sets which are in themselves um collections of tables and I would be able to query these uh tables as well but you don’t need to worry about that now because in this course we will only focus on our own data that lives in our own project so this in short is how data is organized in big query now for the purpose of this course I recommend creating a new data set so so that our tables can be neatly organized and to do that I can click the three dots next to the project uh ID over here and select create data set and here I need to pick a name for the data set so I will call this fantasy and I suggest you use the same name because if you do then the code that I share with you will work immediately then as for the location you can select the multi region and choose the region that is closest to you and finally click on create data set so now the data set fantasy has been created and if I try to expand it here I will see that it is empty because I haven’t loaded any data yet the next step is to load our tables so I assume that you have downloaded the zip file with the tables and extracted it on your local computer and then we can select the action point here next to the fantasy data set and select create table now as a source I will select upload and here I will click on browse and access the files that I have downloaded and I will select the first table here here which is the characters table the file format is CSV so Google has already understood that and scrolling down here I need to choose a name for my table so I will call it just like the file uh which is characters and very important under schema I need to select autodetect and we will see what this means in a bit but basically this is all we need so now I will select create table and now you will see that the characters table has appeared under the fantasy data set and if I click on the table and then go on preview I will should be able to see my data I will now do the same for the other two tables so again create table source is upload file is inventory repeat the name and select autod detect and I have done the same with the third table so at the end of this exercise the fantasy data set should have three tables and you can select them and go on preview to make sure that the data looks as expected now our data is fully loaded and we are ready to start querying it within big query now let’s take a look at how the bigquery interface works so on the left here you can see the Explorer which shows all the data that I have access to and so to get a table in big query first of all you open the name of the project and then you look at the data sets that are available within this project you open a data set and finally you see a table such as characters and if I click now on characters I will open the table view now in the table view I will find a lot of important information about my table in these tabs over here so let’s look at the first tab schema the schema tab shows me the structure of my table which as we shall see is very important and the schema is defined essentially by two things the name of each column in my table and the data type of each column so here we see that the characters table contains a few columns such as ID name Guild class and so on and these columns have different data types for example ID is an integer which means that it contains natural numbers whereas name is string which means that it contains text and as we shall see the schema is very important because it defines what you can do with the table and next we have the details tab which contains a few things first of all is the table ID and this ID represents the full address of the table and this address is made up of three components first of all you have the ID of the project which is as you can see the project in which I’m working and it’s the same that you see here on the left in the Explorer tab the next component is the data set that contains the table and again you see it in the Explorer Tab and finally you have the name of the table this address is important because it’s what we use to reference the table and it’s what we use to get data from this table and then we see a few more things about the table such as when it was created when it was last modified and here we can see the storage information so we can see here that this table has 15 rows and on the dis it occupies approximately one kilobyte if you work extensively with P query this information will be important for two reasons number one it defines how much you are paying every month to store this table and number two it defines how much you would pay for a query that scans all the data in this table and as we have seen in the lecture on bigquery pricing these are the two determinants of bigquery costs however for the purpose of this course you don’t need to worry about this because the tables we are working with are so small that they won’t put a dent in your free month monthly allowance for using big query next we have the preview tab which is really cool to get a sense of the data and this basically shows you a graphical representation of your table and as you will notice it looks very similar to a spreadsheet so you can see our columns the same ones that we saw in the schema tab ID name Guild and so on and as you remember we saw that ID is an integer column so you can only contain numbers name is a text column and then you see that this table has 15 rows and because it’s such a small table all of it fits into this graphical representation but in the real world you may have tables with millions of rows and in this case the preview will show you only a small portion of that table table but still enough to get a good sense of the data now there are a few more tabs in the table view we have lineage data profile data quality but I’m not going to look at them now because they are like Advanced features in bigquery and you won’t need them in this course instead I will run a very basic query on this table and this is not for the purpose of understanding query that will come soon it is for the purpose of showing you what the interface looks like after you run a query so I have a very basic query here that will run on my table and you can see that the interface is telling me how much data this query will process and this is important because this is the main determinant of cost in bigquery every query scans a certain amount of data and you have to pay for that but as we saw in the lecture of bigquery pricing this table is so small that you could run a million or more of these queries and not exhaust your monthly allowance so if you see 1 kilobyte you don’t have to worry about that so now I will click run and my query will execute and here I get the query results view this is the view that that appears after you have successfully run a query so we have a few tabs here and the first step that you see is results and this shows you graphically the table that was returned by your query so as we shall see every query in SQL runs on a table and returns a table and just like the preview tab showed you a graphical view of your table the results tab shows you a graphical view of the table that your query has returned and this is really the only tab in the query results view that you will need on this course the other ones show different features or more advanced features that we won’t look at but feel free to explore them on your own if you are curious but what’s also important in this view is this button over here save results which you can use to EXP report the result of your query towards several different destinations such as Google drive or local files on your computer in different formats or another big query table a spreadsheet in Google Sheets or even copying them to your clipboard so that you can paste them somewhere else but we shall discuss this more in detail in the lecture on getting data in and out of big query finally if you click on this little keyboard icon up here you can see a list of shortcuts that you can use in the big query interface and if you end up running a lot of queries and you want to be fast this is a nice way to improve your experience with big query so be sure to check these out we are finally ready to write our first query and in the process we will keep exploring the Fantastic bigquery interface so one way to get started would be to click this plus symbol over here so that we can open a new tab now to write the query the first thing I will do is to tell big query where the data that I want leaves and to do that I will use the from Clause so I will simply write from and my data lives in the fantasy data set and in the characters table next I will tell SQL what data I actually want from this table and the simplest thing to ask for is to get all the data and I can do this by writing select star now my query is ready and I can either click run up here or I can press command enter on my Mac keyboard and the query will run and here I get a new tab which shows me the results now the results here are displayed as a table just as uh we saw in the preview tab of the table and I can get an idea of uh my results and this is actually the whole table because this is what I asked for in the query there are also other ways to see the results which are provided by bigquery such as Json which shows the same data but in a different format but we’re not going to be looking into that for this course one cool option that the interface provides is if I click on this Arrow right here in my tab I can select split tab to right and now I have a bit of less room in my interface but I am seeing the table on the left and the query on the right so that I can look at the structure of the table while writing my query for example if I click on schema here I could see which columns I’m able to um reference in my query and that can be pretty handy I could also click this toggle to close the Explorer tab temporarily if I don’t need to look look at those tables so I can make a bit more room or I can reactivate it when needed I will now close this tab over here go back to the characters table and show you another way that I can write a query which is to use this query command over here so if I click here I can select whether I want my query in a new tab or in a split tab let let me say in new tab and now bigquery has helpfully uh written a temp template for a query that I can easily modify in order to get my data and to break down this template as you can see we have the select Clause that we used before we have the from clause and then we have a new one called limit now the from Clause is doing the same job as before it is telling query where we want to get our data but you will notice that the address looks a bit different from the one that I had used specifically I used the address fantasy. characters so what’s happening here is that fantasy. characters is a useful shorthand for the actual address of the table and what we see here that big query provided is the actual full address of the table or in other words it is the table ID and as you remember the table ID indicates the project ID the data set name and the table name and importantly this ID is usually enclosed by back ticks which are a quite specific character long story short if you want to be 100% sure you can use the full address of the table and bigquery will provide it for you but if you are working within the same project where the data lives so you don’t need to reference the project you can also use this shorthand here to make writing the address easier and in this course I will use these two ways to reference a table interchangeably I will now keep the address that bigquery provided now the limit statement as we will see is simply limiting the number of rows that will be returned by this query no more than 1,000 rows will be returned and next to the select we have to say what data we want to get from this table and like before I can write star and now my query will be complete before we run our query I want to draw your attention to this message over here this query will process 1 kilobyte when run so this is very important because here big query is telling you how much data will be scanned in order to give you the results of this query in this case we are returning um all the data in the table therefore all of the table will be scanned and actually limit does not have any influence on that it doesn’t reduce how much data is scanned so this query will scan 1 kilobyte of data and the amount of data that scanned by the query is the primary determinant of bigquery costs now as you remember we are able to scan up to one terabyte of data each month within the sandbox program and if we wanted to scan more data then we would have to pay so the question is how many of these queries could we run before running out of our free allowance well to answer that we could check how many kilobytes are in a terabyte and if you Google this the conversion says it’s one to um multipli by 10 to the power of 9 which ends up being 1 billion therefore we can run 1 billion of these queries each month before running out of our allowance now you understand why I’ve told you that as long as you work with small tables you won’t really run out of your allowance and you don’t really have to worry about costs however here’s an example of a query that will scan a large amount of data and what I’ve done here is I’ve taken one of the public tables provided by big query which I’ve seen to be quite large and I have told big query to get me all the data for this table and as you can see here big query says that 120 gabt of data will be processed once this query runs now you would need about eight of these queries to get over your free allowance and if you had connected to B query you could also be charged money for any extra work that you do so be very careful about this and if you work with large tables always check this message over here before running the query and remember you won’t actually be charged until you actually hit run on the query and there you have it we learned how the big query interface works and wrote our first SQL query it is important that we understand how data is organized in SQL so we’ve already seen a a preview of the characters table and we’ve said that this is quite similar to how you would see data in a spreadsheet namely you have a table which is a collection of rows and columns and then in this case on every row you have a character and for every character you have a number of information points such as their ID their name their class level and so on the first fundamental difference with the spreadsheet is that if I want to have some data in a spreadsheet I can just open a new one and uh insert some data in here right so ID level name and so on then I could say that I have a character id one who is level 10 and his name is Gandalf and this looks like the data I have in SQL and I can add some more data as well well a new character id 2 level five and the name is frao now I will save this spreadsheet and then some days later someone else comes in let’s say a colleague and they want to add some new data and they say oh ID uh is unknown level is um 20.3 and the name here and then I also want to uh show their class so I will just add another column here and call this Mage now spreadsheets are of course extremely flexible because you can always um add another column and write in more cells and you can basically write wherever you want but this flexibility comes at a price because the more additions we make to this uh to the data model that is represented here the more complex it will get with time and the more likely it will be that we make confusions or mistakes which is what actually happens in real life when people work with spreadsheets SQL takes a different approach in SQL before we insert any actual data we have to agree on the data model that we are going to use and the data model is essentially defined by two elements the name of our columns and the data type that each column will contain for example we can agree that we will use three columns in our table ID level and name and then we can agree that ID will be an integer meaning that it will contain contain whole numbers level will be a integer as well and name will be a string meaning that it contains text now that we’ve agreed on this structure we can start inserting data on the table and we have a guarantee that the structure will not change with time and so any queries that we write on top of this table any sort of analysis that we create for this table will also be durable in time because it will have the guarantee that the data model of the table will not change and then if someone else comes in and wants to insert this row they will actually not be allowed to first of all because they are trying to insert text into an integer column and so they’re violating the data type of the column and they are not allowed to do that in level they are also violating the data type of the column because this column only accepts whole numbers and they’re trying to put a floating Point number in there and then finally there are also violating the column definition because they’re they’re trying to add a column class that was not actually included in our data model and that we didn’t agree on so the most important difference between spreadsheets and SQL is that for each SQL table you have a schema and as we’ve seen before the schema defines exactly which columns our table has and what is the data type of each column so in this case for the characters table we have several columns uh and here we can see their names and then each column has a specific data types and all the most important data types are actually represented here specifically by integer we mean a whole number and by float we mean a floating Point number string is a piece of text Boolean is a value that is either true or false and time stamp is a value that represents a specific point in time all of this information so the number of columns the name of each column and the type of each column they constitute the schema of the table and like we’ve said the schema is as assumed as a given when working in SQL and it is assumed that will not change over time now in special circumstances there are ways to alter the schema of a table but it is generally assumed as a given when writing queries and we shall do the same in this course and why is it important to keep track of the data type why is it important to distinguish between integer string Boolean the simple answer is that the data type defines the type of operations that you you can do to a column for example if you have an integer or a float you can multiply the value by two or divide it and so on if you have a string you can turn that string to uppercase or lowercase if you have a time stamp you can subtract 30 days from that specific moment in time and so on so by looking at the data type you can find out what type of work you can do with a column the second fundamental difference from spreadsheets is that spreadsheets are usually disconnected but SQL has a way to define connections between tables so what we see here is a representation of our three tables and for each table you can see the schema meaning the list of columns and their types but the extra information that we have here is the connection between the tables so you can see that the inventory table is connected to the items table and also to the character table moreover the characters table is connected with itself now we’re not going to explore this in depth now because I don’t want to add too much Theory we will see this in detail in the chapter on joints but it is a fundamental difference from spreadsheets that SQL tables can be clearly connected with each other and that’s basically all you need to understand how data is organized in SQL for now you create a table and when creating that table you define the schema the schema is the list of columns and their names and their data types you then insert data into this table and finally you have a way to define how the tables are connected with each other I will now show you how SQL code is structured and give you the most important concept that you need to understand in order to succeed at SQL now this is a SQL statement it is like a complete sentence in the SQL language the statement defines where we want to get our data from and how we want to receive these data including any processing that we want to apply to it and once we have a statement we can select run and it will give us our data now the statement is made up of building block blocks which we call Clauses and in this statement we have a clause for every line so the Clauses that we see here are select from where Group by having order and limit and clauses are really the building blocks that we assemble in order to build statements what this course is about is understanding what each Clause is and how it works and then understanding how we can put together these Clauses in order to write effective statements now the first thing that you need to understand is that there is an order to write in these Clauses you have to write them in the correct order and there is no flexibility there if you write them in the wrong order you will simply get an error for example if I I were to take the work clause and put it below the group Clause you can see that I’m already getting an error here which is a syntax error but you don’t have to worry about memorizing this now because you will pick up this order as we learn each clause in turn now the essential thing that you need to understand and that slows down so many SQL Learners is that while we are forced by SQL to write Clauses in this specific order this is not actually the order in which the Clauses are executed if you’ve interacted with another programming language such as python or or JavaScript you’re used to the fact that each line of your program is executed in turn from top to bottom generally speaking and that is pretty transparent to understand but this is not what is happening here in SQL to give you a sense of the order in which these Clauses are run on a logical level what SQL does is that first it reads the from then it does the wear then the group by then the having then it does the select part after the select part is do it does the order by and finally the limit all of this just to show that the order in which operations are executed is not the same as the order in which they’re written in fact we can distinguish three orders that pertain to SQL Clauses and this distinction is so important to help you master SQL the first level is what we call the lexical order and this is simply what I’ve just shown you it’s the order in which you have to write these Clauses so that SQL can actually execute the statement and not throw you an error then there’s the logical order and this is the order in which the clause are actually run logically in the background and understanding this logical order is crucial for accelerating your learning of SQL and finally for the sake of completeness I had to include the effective order here because what happens in practice is that your statement is executed by a SQL engine and that engine will usually try to take shortcuts and optimize things and save on processing power and memory and so the actual order might be a bit different because the Clauses might be moved around um in the process of optimization but like I said I’ve only included it for the sake of completeness and we’re not going to worry about that level in this course with we are going to focus on mastering the lexical order and The Logical order of SQL Clauses and to help you master The Logical order of SQL Clauses or SQL operations I have created this schema and this is the fundamental tool that you will use in this course this schema as you learn it progressively will allow you to build a powerful mental model of SQL that will allow you to tackle even the most complex and tricky SQL problems now what this schema shows you is all of the Clauses that you will work with when writing SQL statements so these are the building blocks that you will use in order to assemble your logic and then the sequence in which they’re shown is corresponding to The Logical order in which they are actually executed and there are three simple rules for you to understand this schema the first rule is that operations are EX executed sequentially from left to right the second rule is that each operation can only use data that was produced by operations that came before it and the third rule is that each operation cannot know anything about data that is produced by operations that follow it what this means in practice is that if you take any of these components for example the having component you already know that having will have access to data that was produced by the operations that are to to its left so aggregations Group by where and from however having will have absolutely no idea of information that is produced by the operations that follow for example window or select or Union and so on of course you don’t have to worry about understanding this and memorizing it now because we will tackle this gradually throughout the course and throughout the course we will go back to the schema again and again in order to make sense of the work we’re doing and understand the typical errors and Pitfall that happen when working with SQL now you may be wondering why there are these two cases where you actually see two components stacked on top of each other that being from and join and then select an alas these are actually components that are tightly coupled together and they occur at the same place in The Logical ordering which is why I have stacked them like this in this section we tackle the basic components that you need to master in order to write simple but powerful SQL queries and we are back here with our schema of The Logical order of SQL operations which is also our map for everything that we learn in this course but as you can see there is now some empty space in the schema because to help us manage the complexity I have removed all of the components that we will not be tackling in this section let us now learn about from and select which are really the two essential components that you need in order to write the simplest SQL queries going back now to our data let’s say that we wanted to retrieve all of the data from the characters table in the fantasy data set now when you have to write a SQL query the first question you need to ask yourself is where is the data that I need because the first thing that you have to do is to retrieve the data which you can then process and display as needed so in this case it’s pretty simple we know that the data we want leaves in the characters table once you figured out where your data leaves you can write the from Clause so I always suggest starting queries with the from clause and to get the table that we need we can write the name of the data set followed by a DOT followed by the name of the table and you can see that bigquery has recognized the table here so I have written the from clause and I have specified the address of the table which is where the data leaves and now I can write the select clause and in the select Clause I can specify which Columns of the table I want to see so if I click on the characters table here it will open in a new tab in my panel and as you remember the it shows me here the schema of the table and the schema includes the list of all the columns now I can simply decide that I want to see the name and the guilt and so in the select statement here I will write name and guilt and when I run this I get the table with the two columns that I need and one neat thing about this I could write the columns in any order it doesn’t have to be the original order of the schema and the result will show that order and if I I wanted to get all of The Columns of the table I could write them here one by one or I could write star with which is a shorthand for saying please give me all of the columns so this is the corresponding data to our table in Google Sheets and if you want to visualize select in your mind you can imagine it as vertically selecting the parts of the table that you need for example if I were to write select Guild and level this would be equivalent to taking these two columns over here and selecting them let us now think of The Logical order of these operations so first comes the from and then comes the select and this makes logical sense right because the first thing you need to do is to Source the data and later you can select the parts of the data that you need in fact if we look at our schema over here from is the very first component in The Logical order of operations because the first thing that we need to do is to get our data we have seen that the select Clause allows us to get any columns from our table in any order but the select Clause has many other powers so let’s see what else we can do with it one useful thing to know about SQL is that you can add comments in the code and comments are parts of text which are not uh executed as code they’re just there for you to um keep track track of things or or explain what you are doing so I’m going to write a few comments now and the way we do comments is by doing Dash Dash and now I’m going to show you aliasing aliasing is simply renaming a column so I could take the level column and say as character level provided a new name and after I run this we can see that the name of the colum has changed now one thing that’s important to understand as we now start transforming the data with our queries is that any sort of change that we apply such as in this case we change the name of the column it only affects our results it does not affect the original table that we are querying so no matter what we do here moving forward Ward the actual table fantasy characters will not change all that will change are the results that we get after running our query and of course there are ways to go back to Fantasy characters and permanently change it but that is outside the scope for us and going back to our schema you will see that Alias has its own component and it happens happens at the same time as the select component and this is important because as we will see in a bit that it’s a common temptation to use these aliases these labels that we give to columns in the phases that precede this stage which typically fails because as our rules say um every component does not have access to data that is computed after it so something that we will come back to now another power of Select that we want to show is constants and constants is the ability of creating new columns which have a constant value for example let’s say that I wanted to implement a versioning system for my characters and I would say that right now all the characters I have are version one but then in the future every time I change a character I will increase that version and so that will allow me to keep track of changes I can do that by simply writing one over here in the column definition and when I run this you will see that SQL has created a new column and it has put one for every Row in that column this is why we call it a constant column so if I scroll down down all of it will be one and this column has a weird name because we haven’t provided a name for it yet but we already know how to do this we can use the alas sync command to say to call it version and here we go so in short when you write a column name in the select statement SQL looks for that column in the table and gives you that column but when instead you write a value SQL creates a new column and puts that value in every Row the next thing that SQL allows me to do is calculations so let me call the experience column here as well and get my data now one thing I could do is to take experience and divide it by 100 so what we see here is a new column which is the result of this calculation now 100 is a constant value right so you can imagine in the background SQL has created a new column and put 100 in every row and then it has done the calculation between experience and that new column and we get this result and and in short we can do any sort of calculation we want combining current columns and constants as well for example although this doesn’t make any sense I could take experience add 100 to it divided by character level and then multiply it by two and and we see that we got an error can you understand why we got this error pause the video and think for a second I am referring to my column as character level but what is character level really it is a label that I have assigned over here now if we go back to our schema we can see that select and Alias happen at the same time so so this is the phase in which we assign our label and this is also the phase in which we try to call our label now if you look at our rules this is not supposed to work because an operation can only use data produced by operations before it and Alias does not happen before select it happens at the same time in other words this part part over here when we say character level is attempting to use information that was produced right here when we assigned the label but because these parts happen at the same time it’s not aware of the label all this to say that the logical order of operations matters and that what we want here is to actually call it level because that is the name of the column in the table and now when I run this I get a resulting number and so going back to our original point we are able to combine columns and constants with any sort of arithmetic operations another very powerful thing that SQL can do is to apply functions and a function is a prepackaged piece of logic that you can apply to our data and it works like this there is a function called sqrt which stands for square root which takes a number and computes the square root so you call the function by name and then you open round brackets and in round brackets you provide the argument and the argument can be a constant such as 16 or it can be a column such as level and when I run this you can see that in this case the square root of 16 is calculated as four and this creates a constant column and then here for each value of level we have also computed the square root there are many functions in SQL and they vary according to the data type which you provide as you remember we said that knowing the data types of columns such as distinguishing between numbers and text is important because it it allows us to know which operations we can apply and so there are functions that work only on certain data types for example here we see square root which only works on numbers but we also have text functions or string functions which only work on text one of them is upper so if I take upper and provide Guild as an argument what do you expect will happen we have created a new column where the G is shown in all uppercase so how can I remember which functions there are and how to use them the short answer is I don’t uh there are many many functions in SQL and here in the documentation you can see a very long list of all the functions that you can use in big query and as we said the functions vary according to the data that they can work on so if you look look here on the left we have array functions um date functions mathematical functions numbering functions time functions and so on and so on it is impossible to remember all of these functions so all you need to know is how to look them up when you need them for example if I know I need to work with numbers I could scroll down here and go to mathematic iCal functions and here I have a long list of all the mathematical functions and I can see them all on the right and I should be able to find the square root function that I have showed you and here the description tells me what the function does and it also provides some examples to summarize these are some of the most powerful things you can do with a select statement not only you can retrieve every column you need in any order you can rename columns according to your needs you can Define constant columns with a value that you choose you can combine columns and constant columns in all sorts of calculations and you can apply functions to do more complex work I definitely invite you to go ahead and put your own data in big query as a I’ve shown you and then start playing around with select and see how you can transform your data with it one thing worth knowing is that I can also write queries that only include select without the front part that is queries that do not reference a table let’s see how that works now after I write select I clearly cannot reference any columns because there is no table but I can still reference constant for example I could say hello one and false and if I run this I get this result so remember in SQL we always query tables and we always get back tables in this case we didn’t reference any previous table we’ve just created constants so what we have here are three columns with constant values and there is only one row in the resulting table this is useful mainly to test stuff so let’s say I wanted to make sure that the square root function does what I expect it to do so I could call it right here and uh look at the result let’s use this capability to look into the order of arithmetic operations in SQL so if I write an expression like this would you be able to compute the final result in order to do that you should be able to figure out the order in which all these operations are done and you might remember this from arithmetic in school because SQL applies the same order that is taught in school and we could Define the order as follows first you would execute any specific functions that take a number as Target and uh then you have multi multiplication and division then you have addition and subtraction and finally brackets go first so you first execute things that are within brackets so pause the video and apply these rules and see if you can figure out what this result will give us now let’s do this operation and do it in stages like we were doing in school so first of all we want to worry about what’s in the brackets right so I will now consider this bracket over here and in this bracket we have the multiplication and addition multiplication goes first so first I will execute this which will give me four and then I will have 3 + 4 + 1 which should give me 8 next I will copy the rest of the operation and here here I reach another bracket to execute what is in these brackets I need to First execute the function so this is the power function so it takes two and exponentiate it to the power of two which gives four and then 4 minus 2 will give me two and this is what we get now we can solve this line and first of all we need to execute multiplication and division in the order in which they occur so the first operation that occurs here is 4 / 2 which is 2 and I will just copy this for clarity 8 – 2 * 2 / 2 the next operation that occurs now is 2 * 2 which is 4 so that would be 8 – 4 / 2 and the next operation is 4 / 2 which is two so I will have 8 – 2 and all of these will give me a six now all of these are comments and we only have one line of code here and to see whether I was right I just need to execute this code and indeed I get six so that’s how you can use the select Clause only to test your assumptions and uh your operations and a short refresher on the order of arithmetic operations which will be important for solving certain sequal problems let us now see how the where statement works now looking at the characters table I see that there is a field which is called is alive and this field is of type Boolean that means that the value can be either true or false so if I go to the preview here and scroll to the right I can see that for some characters this is true and for others it is false now let’s say I only wanted to get those characters which are actually alive and so to write my query I would first write the address of the table which is fantasy characters next I could use the where Clause to get those rows where is a five is true and finally I could do a simple select star to get all the columns and here I see that I only get the rows where is alive is equal to true so where is effectively a tool for filtering table rows it filters them because it only keeps rows where a certain condition is true and discards all of the other rows so if you want to visualize how the wear Filter Works you can see it as a horizontal selection of certain slices of the table like in this case where I have colored all of the rows in which is alive is true now the we statement is not limited to Boolean Fields it’s not limited to columns that can only be true or false we can run the we filter on any column by making a logical statement about it for example I could ask to keep all the rows where Health number is bigger than 50 this is a logical statement Health bigger than 50 because it is either true or fals for every row and of course the wh filter will only keep those rows where this statement evaluates to true and if I run this I can see that in all of my results health will be bigger than 50 and I can also combine smaller logical statements with each other to make more complex logical statements for example I could say that I want all the rows where health is bigger than 50 and is a live is equal to true now all of this becomes one big logical statement and again this will be true or false for every row and we will only keep the rows where it is true and if I run this you will see that in the resulting table the health value is always above 50 and is alive is always true in the next lecture we will see in detail how these logical statements work and how we can combine them effectively but now let us focus on the order of operations and how the wear statement fits in there when it comes to the lexical order the order in which we write things it is pretty clear from this example first you have select then from and after from you have the WHERE statement and you have to respect this order when it comes to The Logical order you can see that the where Clause follows right after the from Clause so it is second actually in The Logical order if you think about it this makes a lot of sense because the first thing that I need to do is to get the data from where it Lees and then the first thing I want to do after that is is that I’m going to drop all the rows that I don’t need so that my table becomes actually smaller and easier to deal with there is no reason why I should carry over rows that I don’t actually need data that I don’t actually want and waste memory and processing power on it so I want to drop those unneeded rows as soon as possible and now that you know that where happens at this stage in The Logical order you can avoid many of the pitfalls that happen when you’re just learning SQL let’s see an example now take a look at this query I’m going to the fantasy characters table and then I’m getting the name and the level and then I’m defining a new column this is simply level divided by 10 and I’m calling this level scaled now let’s say that I wanted to only keep the rows that have at at least three as level scaled so I would go here and write aware filter where level scaled bigger than three and if I run this I get an error unrecognized name can you figure out why we get this error level scaled is an alas that we assign in the select stage but the we Clause occurs before the select stage so the we Clause has no way to know about this alias in other words the we Clause is at this point and our rules say that an operation can only use data produced by operations before it so the we Clause has no way of knowing about the label which is a sign at this stage so how can we solve this problem right here the solution is to not use the Alias and to instead repeat the logic of the transformation and this actually works because it turns out that when you write logical statements in the we filter you can not only reference The Columns of the tables but you can also reference operations on columns and this way of writing operations of on columns and combinations between columns works just as what we have shown in the select part so that was all you need to know to get started with the wear clause which is a powerful Clause that allows us to filter out the row that we don’t need and keep the rows that we need based on logical conditions now let’s delve a bit deeper into how exactly these logical statements work in SQL and here is a motivating example for you this is a selection from the characters table and we have a wear filter and this we filter is needlessly complicated and I did this intentionally because by the end of this lecture you should have no trouble at all interpreting this statement and figuring out for which rows it will be true and likewise you will have no problem writing complex statements yourself or deciphering them when you encounter them in the wild the way that these logical statements work is through something called Boolean algebra which is an essential theory for working with SQL but also for working with any other programming language and is indeed fundamental to the way that computers work and though the name may sound a bit scary it is really easy to understand the fundamentals of Boolean algebra now let’s look back at so-called normal algebra meaning the common form that is taught in schools in this algebra you have a bunch of elements which in this case I’m only showing a few positive numbers such as 0 25 100 you also have operators that act on these elements for example the square root symbol the plus sign the minus sign the division sign or the multiplication sign and finally you have operations right so in operations you apply The Operators to your elements and then you get some new elements out of them so here are two different types of operation in one case we take this operator the square root and we apply it to a single element and out of this we get another element in the second kind of operation we use this operator the plus sign to actually combine two elements and again we get another element in return Boolean algebra is actually very similar except that it’s simpler in a way because you can only have two elements either true or false those are all the elements that you are working with and of course this is why when there’s a Boolean field in SQL it is a column that can only have these two values which are true and false now just like normal algebra Boolean algebra has several operators that we can use to transform the elements and for now we will only focus on the three most important ones which are not and and or and finally in Boolean algebra we also have operations and in operations we combine operators and elements and get back elements now we need to understand how these operators work so let us start with the not operator to figure out how a Boolean operator works we have to look at something that’s called a truth table so let me look up the truth table for the not operator and in this Wikipedia article this is available here at logical negation now first of all we see that logical negation is an operation on one logical value what does this mean it means that the not operator works on a single element such as not true or not false and this this is similar to the square root operator in algebra that works on a single element a single number next we can see how exactly this works so given an element that we call P and of course P can only be true or false the negation of p is simply the opposite value so not true is false and not false is true and we can easily test this in our SQL code so if I say select not true what do you expect to get we get false and if I do select not false I will of course get true next let’s see how the end operator works so we’ve seen that the not operator works on a single element on the other hand the end operator connects two elements such as writing true and false and in this sense the end operator is more similar to the plus sign here which is connecting two elements so what is the result of true and false to figure this out we have to go back to our truth tables and I can see here at The Logical conjunction function section which is another word for the end operator now the end operator combines two elements and each element can either be true or false so this creates four combinations that we see here in this table and what we see here is that only if both elements are true then the end operator will return true in any other case it will return false so going back here if I select true and false what do you expect to see I am going to get false and it’s only in the case when I do true and true that the result here will be true and finally we can look at the or operator which is also known as a logical disjunction it’s also combining two elements it also has four combinations but in this case if at least one of the two elements is true then you get true and only if both elements are false then you get false and so going back to our SQL true or true will of course be true but but even if one of them is false we will still get true and only if both are false we will get false so now you know how the three most important operators in Boolean algebra work now the next step is to be able to solve long and complex Expressions such as this one and you already know how operators work the only information you’re missing is the order of operations and just like in arithmetic we have an agreed upon order of operations that helps us solve complex expressions and the Order of Operations is written here first you solve for not then you solve for and and finally for or and as with arithmetic you first solve for the brackets so let’s see how that works in practice let us now simplify this expression so the first thing I want to do is to deal with the brackets so if I copy all of this part over here as a comment so it doesn’t run as code you will see that this is the most nested bracket the innermost bracket in our expression and we have to solve for this so what is true or true this is true right and now I can copy the rest of my EXP expression up to here and here I can solve the innermost bracket as well so I can say true and what I have here is false and true so this is false right because when you have end both of them need to be true for you to return true otherwise it’s false so I will write false moving on to the next line I need to solve what’s in the bracket so I can copy the knot and now I have to solve what’s in this bracket over here now there are several operators here but we have seen that not has the Precedence right so I will copy true and here I have not false which becomes true and then I can copy the last of the bracket I’m not going to do any more at this step to avoid confusion and then I have or and I can solve for this bracket over here and true and false is actually false moving on I can keep working on my bracket and so I have a lot of operations here but I need to give precedence to the ends so the first end that occurs is this one and that means I have to start with this expression over here true and and true results in true and then moving on I will copy the or over here and now I have another end which means that I have to isolate this expression false and true results in false and finally I can copy the final end because I’m not able to compute it yet because I needed to compute the left side and I can copy the remaining part as well moving on to the next line um I need to still do the end because the end takes precedence and so this is the expression that I have to compute so I will say true or and then this expression false and true computes to false and then copy the rest now let me make some rul over here and go to the next line and I can finally compute this bracket we have true or false which we know is true next I need to invert this value because I have not true which is false and then I have or false and finally this computes to false and now for the Moment of Truth F intended I can run my code and see if the result actually corresponds to what we got and the result is false so in short this is how you can solve complex expressions in Boolean algebra you just need to understand how these three operators work and you can use truth tables like like this one over here to help you with that and then you need to remember to respect the order of operations and then if you proceed step by step you will have no problem solving this but now let’s go back to the query with which we started because what we have here is a complex logical statement that is plugged into the wear filter and it isolates only certain rows and we want to understand exactly how this statement works so let us apply what we’ve just learned about Boolean algebra to decipher this statement now what I’ve done here is to take the first row of our results which you see here and just copi the values in a comment and then I’ve taken our logical statement and copied it here as well so let us see what SQL does when it checks for this Row the first thing that we need to do is to take all of these statements in our wear filter and convert them to true or false and to do that we have to look at our data let us start with the first component which is level bigger than 20 so for the row that we are considering level is 12 so this comes out as false next I will copy this end and here we have is alive equals true now for our row is alive equals false so this statement computes as false Mentor ID is not null with null representing absence of data in our case Mentor ID is one so it is indeed not null so here we have true and finally what we have in here is class in Mage Archer so we have not seen this before but it should be pretty intuitive this is a membership test this is looking at class which in this case is Hobbit and checking whether it can be found in this list and in our case this is now false so now that we’ve plugged in all the values for our row what we have here is a classic Boolean algebra expression and we are able to solve this based on what we’ve learned so let us go and solve this and first I need to deal with the brackets and what I have here I have an end and an or and the end TR takes precedence so false and false is false and I will copy the rest and here I have not false which is true next we have false or true which is true and true and in the end this computes to true now in this case we sort of knew that the result was meant to come out as true because we started from a row that survived the wear filter and that means that for this particular row this statement had to compute as true but it’s still good to know exactly how SQL has computed this and understand exactly what’s going on and this is how SQL deals with complex logical statements for each row it looks at the relevant values in the row so that it can convert the statement to a Boolean algebra expression and then it uses the Boolean algebra rules to compute a final result which is either true or false and then if this computes as true for the row then the row is kept and otherwise the row is discarded and this is great to know because this way of resoling solving logical statements applies not only to the word component but to all components in SQL which use logical statements and which we shall see in this course let us now look at the distinct clause which allows me to remove duplicate rows so let’s say that I wanted to examine the class column in my data so I could simply select it and check out the results so what if I simply wanted to see all the unique types of class that I have in my data this is where distinct comes in handy if I write distinct here I will see that there are only four unique classes in my data now what if I was interested in the combinations between class and guilt in my data so let me remove the distinct from now and add guilt here and for us to better understand the results I’m going to add an ordering and here are the combinations of class and Guild in my data there is a character who is an Archer and belongs to Gondor and there are actually two characters who are archers and belong belong to mirkwood and there are many Hobbits from sholk and so on but again what if I was interested in the unique combinations of class and Guild in my data I could add the distinct keyword here and as you can see there are no more repetitions here Archer and merkwood occurs only once Hobbit and Shar f occurs only once because I’m only looking at unique combinations and of course I could go on and on and add more columns and expand the results to show the unique combinations between these columns so here Hobbit and sherol has expanded again because some Hobbits are alive and others unfortunately are not at the limit I could have a star here and what I would get back is actually my whole data all the 15 rows because what we’re doing here is looking at rows that have the same value on all columns rows that are complete duplicates and there are no such rows in the data so when I do select star in this case distinct has no effect so in short how distinct works it looks at the columns that you’ve selected only those which you have selected and then it looks at all the rows and two rows are duplicate if they have the exact same values on every column that you have selected and then duplicate rows are removed and only unique values are preserved so just like the wear filter the distinct is a clause that removes certain rows but it is more strict and less flexible in a sense it only want does one job and that job is to remove duplicate rows based on your selection and if we look at our map of SQL operations we can place distinct it occurs right after select right and and this makes sense because we have seen that distinct Works only on the columns that you have selected and so it has to wait for select to choose the columns that we’re interested in and then we can D duplicate based on those for the following lecture on unions I wanted to have a very clear example so I decided to go to the characters table and split it in two and create two new tables out of it and then I thought that I should show you how I’m doing this because it’s a pretty neat thing to know and it will help you when you are working with SQL in bigquery so here’s a short primer on yet another way to create a table in bigquery you can use your newly acquired power of writing cql queries to turn those queries into permanent tables so here’s how you can do it first I’ve written a simple query here and you should have no trouble understanding it by now go to the fantasy characters table keep only rows where is alive is true and then get all the columns next we need to choose where the new table will live and how it will be called so I’m placing it also in the fantasy data set and I’m calling it characters alive and finally I have a simple command which is create table now what you see here is a single statement in SQL it’s a single command that will create the table and you can have in fact multiple statements within the same code and you can run all the statements together when you hit run the trick is to separate all of them with this semicolon over here the semicolon tell SQL hey this command over here is over and and uh next I might add another one so here we have the second statement that we’re going to run and this looks just like the one above except that our query has changed because we’re getting rows where is alive is false and then we are calling these table characters dead so I have my two statements they’re separated by semicolons and I can just hit run and I will see over here that bigquery is showing me the two statements on two different rows and you can see that they are both done now so if I open my Explorer over here I will see that I have two new tables characters alive and characters dead and if I go here for characters alive is alive will of course be true on every row now what do you think would happen if I ran this script again let’s try it so I get an error the error says that the table already exists and this makes sense because I’ve told SQL to create a table but SQL says that table already exists I cannot create it again so there are ways that we can tell SQL what to do if the table already exists again so that we specify the behavior we want and we are not going to just get an error one way is to say create or replace table fantasy characters alive and what this will do is that if the table already exists uh big query will delete it and then create it again or in other words it will overwrite the data so let’s write it down to and let’s make sure that this query actually works so when I run this I will get no errors even if the table already existed because bigquery was able to remove the previous table and create a new one alternatively we may want to create the table only if it doesn’t exist yet and leave it untouched otherwise so in that case we could say create table if not exists so what this will do is that if this table is already existing big query won’t touch it and it won’t throw an error but if it doesn’t exist it will create it so let us write it down two and make sure that this query runs without errors and we see that also here we get no errors and that in short is how you can save the results of your queries in big query and make them into full-fledged tables that you can save and and create query at will and I think this is a really useful feature if you’re analyzing data in big query because any results of your queries that you would like to keep you can just save them and then come back and find them later let’s learn about unions now to show you how this works I have taken our characters table and I have split it into two parts and I believe the name is quite self descriptive there is a separate table now for characters who are alive and a separate table for characters who are dead and you can look at the previous lecture to see how I’ve done this how I’ve used a query to create two new tables but this is exactly the characters table with you know the same schema the same columns the same times is just split in two based on the E alive column now now let us imagine that we do not have the fantasy. characters table anymore we do not have the table with all the characters because it was deleted or we never had it in the first place and let’s pretend that we only have these two tables now characters alive and characters dead and we want to reconstruct the characters table out of it we want to create a table with all the characters how can we do that now what I have here are two simple queries select star from fantasy characters alive and select star from fantasy characters dead so these are two separate queries but actually in big query there are ways to run multiple queries at the same time so I’m going to show you first how to do that now an easy way to do that is to write your queries and then add a semicolon at the end and so what you have here is basically a SQL script which contains multiple SQL statements in this case two and if you hit run all of these will be executed sequentially and when you look at the results so you’re not just getting a table anymore because it’s not just a single query that has been executed but you can see that there have been two commands uh that have been executed which are here and then for each of those two you can simply click View results and you will get to the familiar results tab for that and if I want to see the other one I will click on the back arrow here and click on the other view results and then I can see the other one another way to handle this is that I can select the query that I’m interested in and then click run and here I see the results so big query has only executed the part that I have selected or I can decide to run the other query in my script select it click run and then I will see the results for that query and this is a pretty handy functionality in big query it’s also functionality that might give you some headaches if you don’t know about it because if for some reason you selected a part of the code uh during your work and then you just want to run everything you might hit run and get an error here because B queer is only seeing the part that you selected and cannot make sense of it so it’s good to know about this but our problem has not been solved yet because remember we want to reconstruct the characters table and what we have here are two queries and we can run them separately and we can look at the results separately but we still don’t have a single table with all the results and this is where Union comes into play Union allows me to stack the results from these two tables so so if I take first I will take off the semic columns because this will become a single statement and then in between these two queries I will write Union distinct and when I run this you can verify for yourself we have 15 rows and we have indeed reconstructed the characters table so what exactly is going on here well it’s actually pretty simple SQL is taking all of the rows from this first query and then all of the rows for the second query and then it’s stacking them on top of each other so you can really imagine the act of horizontally stacking a table on top of the other to create a new table which contains all of the rows of these two queries combined and that in short is what union does now there are a few details that we need to know when working with Union and to figure them out let us look at a toy example so I’ve created two very simple tables toy one and toy two and you can see how they look in these comments over here they all have three columns which are called imaginatively call One Call two call three and then this is the uh Toy one table and then this is the toy 2 table now just like before we can combine this table tabls by selecting all of them and then writing a union in between them now in B query you’re not allow to write Union without the further qualifier a keyword and it has to be either all or distinct so you have to choose one of these two and what is the choice about well if you do Union all you will get all of the rows that are in the first table and those that are in the second table regardless of whether they are duplicate okay but with Union distinct you will get again all of the rows from the two tables but you will only consider unique rows you will not get any duplicates now we can see that these two table share a column which is actually identical one through yes over here and the same row over here now if I write Union all I expect the result to include this row twice so let us verify that and you can see that here you have one true yes and at the end you also have one true yes and in total you get four rows which are all the rows in the two tables however if I do Union distinct I expect to get three rows and I expect this row to appear only once and not to be duplicated again you need to make sure you’re not selecting any little part of your script before you run it so the whole script will be run and as you can see we have three rows and there are no duplicates now it’s interesting that big query actually forces you to choose between all or distinct because in many SQL systems for your information you are able to write Union without any qualifier and in that case it means Union distinct so in other SQL systems when you write Union it is understood that you want Union distinct and if you actually want to keep the duplicate rows you will explicitly write Union all but in big query you always have to explicitly say whether you want Union all or Union distinct now the reason this command is called Union and not like stack or or something else is is that this is a set terminology right this comes from the mathematical theory of sets which you might remember from school and the idea is that a table is simply a set of rows so this table over here is a set of two rows and this table over here is a set of two rows and once you have two sets you can do various set operations between them and the most common operation that we do in SQL is unioning and unioning means combining the values of two sets so you might remember from school the V diagram which is a typical way to visualize the relations between sets so in this simple vent diagram we have two circles A and B which represent two sets and in our case a represents the collection of rows in the first table and B represents the all the rows that are in the second table so what does it mean to Union these sets it means taking all of the elements that are in both sets so taking all of the rows that are in both tables and what is the difference here between union distinct and Union all where you can see that the rows of a are this part over here plus this part over here and the rows of B are this part over here plus this part over here and so when we combine them we’re actually counting the intersection twice we are counting this part twice and so what do you do with this double counting do you keep it or do you discard it if you do Union all you will keep it so rows that are in common between A and B will duplicate you will see them twice twice but if you do Union distinct you will discard it and so um you won’t have any duplicates in the results so that’s one way to think about it in terms of sets but we also know that Union is not the only set operation right there are other set operations a very popular one is the intersect operation now the intersect looks like this right it it says take only the El elements that are in common between these two sets so can we do that in SQL can we say give me only the rows that are in common between the two tables and the answer is yes we can do this and if we go back here we can instead of Union write intersect and then distinct and what do you expect to see after I run this command take a minute to think about it so what I expect to see is to get only the rows that are shared between the two tables now there is one row which is shared between these two tables which is uh the one true yes row which we have seen and if I run this I will get exactly this row so intersect distinct gives me the rows that are shared between the two tables and I have to write intersect distinct I cannot write intersect all because actually doesn’t mean anything so it’s not going to work and here’s another set operation which you might consider which is subtraction so what if I told you give me all of the elements in a except the elements that a shares with B so what would that look on the drawing it would look like this right so this is taking all of the elements that are in a except these ones over here because they are in a but they’re also in B and I don’t want the elements shared with b and yes I can also do that in squl I can come here and I could say give me everything from Toy one except distinct everything from Toy two and what this means is that I want to get all of my rows from Toy one except the rows that are shared with toy two so what do you expect to see when I run this let’s hit run and I expect to see only this row over here because this other row is actually shared with b and this is what I get again you have to write accept distinct you cannot write accept all because it’s actually actually doesn’t mean anything and keep in mind that unlike the previous two operations which are union and distinct the accept operation is not symmetric right so if I swap the tables over here I actually expect to get a different result right I expect to see this row over here selected because I’m saying give me everything from this table uh Toy 2 except the rows that are shared with toy one so so let us run this and make sure and in fact I get the three through uh maybe row so careful that the accept operation is not symmetric the order in which you put the two tables matters so that was a short overview of Union intersect except and I will link this here which is the bigquery documentation on this and you can see that they’re actually called set operators in fact in real life you almost always see Union very rarely you will see somebody using intersect or accept a lot of people also don’t know about them but I think it’s worth it that we briefly looked at all three and it’s especially good for you to get used to thinking about tables as sets of rows and thinking about SQL operations in terms of set set operations and that will also come in handy when we study joints but let us quickly go back to our toy example and there are two essential prerequisites for you to be able to do a union or any type of sort operations number one the tables must have the same number of columns and number two the columns must have the same same data type so as you can see here we are combining toy 2 and toy 1 and both of them have three columns and the First Column is an integer the second is a Boolean and the third is a string in both tables and this is how we are able to combine them so what would happen if I went to the first table and I got only the first two columns and then I tried to combine it you guessed it I would get an error because I have a mismatched column count so if I want to select only the first two columns in a table I need to select only the first two columns in another table and then the union will work now what would happen if I messed up the order of the columns so let’s say that here I will select uh column one and column 3 and here I will select column one and column two let me run this and I will get an error because of incompatible types string and bull so what’s happening here is that SQL is trying to get the values of call three over here and put it into call two over here and it’s trying to get a string and put it into a Boolean column and that simply doesn’t work because as you know SQL enforces streak Types on columns and so this will not work but of course I could select call three in here as well and now again we will have a string column going into a string column and of course this will work so so to summarize you can Union or intersect or accept any two tables as long as they have the same number of columns and the columns have the same data types let us now illustrate a union with a more concrete example so we have our items table here and our characters table here so the items table repres represents like magical items right while the characters table we’re familiar with it represents actual characters so let’s say that you are managing a video game and someone asks you for a single table that contains all of the entities in that video game right and the entities include both characters and items so you want to create a table which combines these two tables into one we know we can use Union to do that we know we can use Union to stack all the rows but we cannot directly Union these two tables be because they have a different schema right they have a different number of columns and then those columns have different data types but let’s analyze what these two tables have in common and how we could maybe combine that so first of all they both have an ID and in both cases it’s an integer so that’s already pretty good they both have a name and in both cases the name is a string so we can combine that as as well the item type can be thought of being similar to the class and then each item has a level of power which is expressed as an integer and each character has a level of experience which is expressed as an integer and you can think that they are kind of similar and then finally we have a timestamp field representing a moment in time for both columns which are date added and last active so looking at this columns that the two have sort of in common we can find a way to combine them and here’s how we can translate this into SQL right so I’m went to the fantasy items table and I selected The Columns that I wanted and then I went to the characters table and I selected the columns that I wanted to combine with those um in in the right order so we have ID with ID name with name class with item type level with power and last active with date added so I have my columns they’re in the right order I wrote Union distinct and if I run this you will see that I have successfully combined the rows from these two tables by finding out which columns they have in common and then writing them in the right order and then adding Union distinct now all the columns that we’ve chosen for the combination have the same type but what would happen if I wanted to combine two columns that are not actually the same type so let’s say what if we wanted to combine Rarity which is a string with experience which is an integer as you know I cannot do this directly but I can go around it by either taking Rarity and turning it into an integer or taking um experience and turning it into a string I just have to make sure that they both have the same data type now the easiest way is usually to take um any other data type and turn it into a string because we you just turn it into text so let’s say that for the sake of this demonstration we will take integer experience which is an integer and turn it into a string which is text and then combine that with Rarity so I will go back to my code and I will make some room over here and here in items I will add Rarity and here in characters I will add experience and you can see that I already get an error here saying that the union distinct has incompatible types just like expected so what I want to do here is to take experience and turn it into string and I can do that with the cast function so I can do cast experience as string and what this will do is basically take these values and convert them to string and if I run this you can see that this has worked so we combined two tables into one and now the result is a single table it has a column called Rarity the reason it’s called Rarity is that um it’s it’s taking the name from the first table in the in the operation but we could of course rename it to whatever we need and this is now a text column because we have combined a text column with also a text column thanks to the casting function so what we see here are a bunch of numbers which came originally from The Experience uh column from the character table but they’re now converted to text and if I scroll down then I will also see the original values of Rarity from the items table finally let us examine Union in the context of The Logical order of SQL operations so you can see here that we have our logical map but it looks a bit different than usual and the reason it’s different is that we are considering what happens when you un two tables and here the blue represents one table and the red represents the other table so I wanted to show you that all of the ordering that we have seen until now so first get the table then use the filter with where then select the columns you want and if you want use this thing to remove duplicates all of these happens in the same order separately for the two tables that you are unioning and this applies to all of the other operations like joining and grouping which we will see um later in the course so at first the two tables are working on two separate tracks and SQL is doing all this operations on them in this specific order and only at the end of all this only after all of these operations have run then we have the union and in the Union these two tables are combined into one and only after that only after the tables have been combined into one you apply the last two operations which are order by and limit and actually nothing forces you to combine only two tables you could actually have any number of tables that you are combining in Union but then the logic doesn’t change at all all of these operations will happen separately for each of the tables and then only when all of these operations are done only when all of the tables are ready then they will be combined into one and if you think about it it makes a lot of sense because first of all you need the select to have run in order to know what is the schema of the tables that you are combining and then you also also need to know if distinct has run on each uh table because you need to know which rows you need to combine in the union and that is all you need to know to get started with Union this very powerful statement that allows us to combine rows from different tables let us now look at order by so I’m looking at the characters table here and as you can see we have an ID column that goes from one to 15 which assigns an ID to every character but you will see that the IDS don’t appear in any particular order and in fact this is a general rule for SQL there is absolutely no order guarantee for your data your data is not stored in any specific order and your data is not going to be returned in any specific order and the reason for this is fun fundamentally one of efficiency because if we had to always make sure that our data was perfectly ordered that would add a lot of work it would add a lot of overhead to the engine that makes the queries work and uh there’s really no reason to do this however we do often want to order our data when we are querying it we want to order the way that it is displayed and this is why the order by clause is here so let us see how it works I am selecting everything from fantasy characters and again I’m going to get the results in no particular order but let’s say I wanted to see them in uh ordered by name so then I would do order by name and as you can see the rows are now ordered alphabetically according to the name I could also invert the order by writing desk which stands for descending and that means U descending alphabetical order which means from the last letter in the alphabet to the first I can of course also order by number columns such as level and we would see that the level is increasing here and of course that could also be descending to to go in the opposite direction and the corresponding keyword here is ask which stands for ascending and this is actually the default Behavior so even if you omit this you will get the same going from the smallest to the largest I can also order by multiple columns so I could say order by class and then level and what that looks like is that first of all the rows are ordered by class so as you can see this is done alphabetically so first Archer and then the last is Warrior and then within each class the values within the class are ordered according to the level going from the smallest level to the biggest level and I can invert the order of one of them for example class and in this case we will start with Warriors and then within the warrior class we will still will order the level in ascending order so I can for every column uh that’s in the ordering I can decide whether that ordering is in ascending order or descending order now let us remove this and select the name and the class and once again I get my rows in no particular order and I’m seeing the name and the class so I wanted to show you that you can also order by columns which you have not selected Ed so I could order these elements by level even though I’m not looking at at level and it will work all the same and finally I can also order by operations so I could say take level divide it by experience and then multiply that by two for some reason and it would also work in the order ordering even though I am not seeing that calculation that calculation is being done in the background and used for the ordering so I could actually take this here and copy it create a new column call it calc for calculation and if I show you this you will see the results are not uh very meaningful but you will see that they are in ascending order so we have ordered by that and sometimes you will see this notation over here order by 21 for example and as you can see what we’ve done here is that we’ve ordered by class first of all because we starting with archers and going to Warriors and then within each class we are ordering by name uh also in ascending order so this is basically referring to the columns that are referenced in the select two means order by the second column which you have referenced which in this case is class and one means order by the First Column that you referenced so it’s basically a shortcut that people sometimes use to avoid rewriting the names of columns that they have selected and finally when we go back to the order of operations we can see that order bu is happening really at the end of all of this process so as you will recall I have created this diagram that’s a bit more complex to show show what happens when we Union different tables together what happens is that basically all these operations they run independently on each table and then finally the tables get uh unioned together and after all of this is done SQL knows the final list of rows that we will include in our results and that’s the right moment to order those rows it would not be possible to do that before so it makes sense that order is located here let us now look at the limit Clause so what I have here is a simple query it goes to the characters table it filters for the rows where the character is alive and then it gets three columns out of this so let’s run this query and you can see that this query returns 11 rows now let us say that I only wanted to see five of those rows and this is where limit comes into place limit will look at the final results and then pick five rows out of those results reducing the size of my output and here you can see that we get five rows now as we said in the lecture of ordering by default there is no guarantee of order in a SQL system so when you are getting all your data with a query and then you run limit five on top of it you have no way of kn knowing which of the rows will be selected to fit amongst those five you’re basically saying that you’re okay with getting any five of all of the rows from your result because of this people often will use limit in combination with order by for example I could say order by level and then limit five and what I would get here is essenti the first five most inexperienced characters in my data set and let us say that you have a problem of finding the least experienced character in your data the character with the lowest level so of course you could say order by level and then limit one and you would get the character with the lowest level right and this works however it is not ideal there is a problem with this solution so can you figure out what the problem with this solution is the problem will be obvious once I go back to limit 5 and I look here and I see that I actually have two characters which have the lowest level in my data set so in theory I should be able to return both of them because they both have the lowest level however when I write limit one it simply cuts the rows in my output and it is unaware of that uh further information that is here in this second row and in the further lectures we will see how we can solve this better and get results which are more precise and if we look at The Logical order of operations we can see that limit is the very last operation and so all of the logic of our query is executed all our data is computed and then based on that final result we sometimes decide to not output all of it but to Output a limited number of rows so a common mistake for someone who is starting with SQL is thinking that they can use limit in order to have a cheaper query for example you could say oh this is a really large table this table has two terabytes of data it would cost a lot to scan the whole table so I will say select star but then I will put limit 20 because I only want to see the first 20 rows and that will means that I will only scan 20 rows and my query will be very cheap right no that is actually wrong that doesn’t save you anything and you can understand this if you look at the map because all of the logic is going to execute before you get to limit so you’re going to scan the whole table when you say select star and you’re going to apply all of the logic and the limit is actually just changing the way your result is displayed it’s not actually changing the way the your result is computed if you did want to write your query so that it scans less rows one thing you should do is focus on the where statement actually because the where statement is the one that runs in the beginning right after getting the table and it is able to actually eliminate rows which usually saves you on computation and money and so on however I do need to say that there are systems where writing limit may actually turn into savings because different systems are optimized in different ways and um allow you to do different things with the commands but as a rule usually with SQL limit is just changing the way your result is displayed and doesn’t actually change anything in the logic of execution let us now look at the case clause which allows us to apply conditional logic in SQL so you can see here a simple query I am getting the data from the characters table I am filtering it so that we only look at characters who are alive and then for each character we’re getting the name and the level now when you have a column that contains numbers such as level one typical thing that you do in data analysis is bucketing and bucketing basically means that I look at all these multiple values that level can have and and I reduce them to a smaller number of values so that whoever looks at the data can make sense of it uh more easily now the simplest form of bucketing that you can have is the one that has only two buckets right so looking at level our two buckets for example could be uh in one bucket we put values that are equal or bigger than 20 so characters who have a level that’s at least 20 and in the other bucket we put all the characters that have a level that is less than 20 for example now how could I Define those two buckets so we know that we can Define new columns in the select statement and that we can use calculations and logical statements to define those columns so one thing that I could do would be to go here and then write level bigger than bigger or equal than 20 and then call this new column level at least 20 for example and when I run this I get my column now of course this is a logical statement and for each row this will be true or false and then you can see that our new column here gives us true or false on every column and this is a really basic form of bucketing because it allows us to take you know level has basically 11 different values in our data and it can be complicated to look at this many values at once and now we’ve taken these 11 values and reduced them to two uh to two buckets so that we have um organized our data better and it’s easier to read but there are two limitations with this approach one I might not want to call my buckets true or false I might want to give more informative names to my buckets such as experienced or inexperienced for example the other limitation is that with this approach I can effectively only divide my data in two buckets because once I write a logical statement it’s either either true or false so my data gets divided in two but often it’s the case that I want to use multiple buckets for my use case now bucketing is a typical use case for the case when statement so let’s see it in action now so let me first write a comment not any actual code where I Define what I want to do and then I will do it with the code so I have written here the buckets that I want to use to classify the characters level so up to 15 they are considered low experience between 15 and 25 they are considered mid and anything above 25 we will classify as super now let us apply the case Clause to make this work so the case Clause Is Always bookended by these two parts case and end so it starts with case it ends with end and a typical error when you’re getting started is to forget about the end part so my recommendation is to always start by writing both of these and then going in the middle to write the rest now in the middle we’re going to Define all the conditions that we’re interested in and each condition starts with the keyword when and is Then followed by a logical condition so our logical condition here is level smaller than 15 now we have to Define what to do when this condition is true and it follows with the keyword then and when this condition is true we want to return the value low which is a string a piece of text that says low next we proceed with the following condition so when level is bigger and equal to 15 and level is lower than 25 so if you have trouble understanding this logical statement I suggest you go back to the lecture about Boolean algebra but what we have here there are two micro statements right Level under 25 and level equal or bigger than 15 they are conect connected by end which means that both of these statements have to be true in order for the whole statement to be true which is what we want in this case right and what do we want to return in this case we will return the value mid and the last condition that we want to apply when level is bigger or equal than 25 then we will return super now all of this that you see here this is the case Clause right or the case statement and all of this is basically defining a new column in my table and given that it’s a new column I can use the alas sync to also give it a name and I can call this level bucket now let’s run this and see what we get and as you can see we have our level bucket and the characters that are above 25 are super and then we have a few Ms and then everyone who’s under 15 is low so we got the results we wanted and now let us see exactly how the case statement works so I’m going to take Gandalf over here and he has level 30 so I’m going to write over here level equals 30 because we’re looking at the first low row and that is the value of level and then I’m going to take the conditions for the case statement that we are examining and add them here as a comment now because in our first row level equals 30 I’m going to take the value and substitute it here for level now what we have here is a sequence of logical statements and we have seen how to work with these logical statements in the lecture on Boolean algebra now our job is to go through each of these logical statements in turn and evaluate them and then as soon as we find one that’s true we will stop so the first one is 30 smaller than 50 now this is false so we continue the second one is a more complex statement we have 30 greater or equal to 15 which is actually true and 30 Oops I did not substitute it there but I will do it now and 30 smaller than 25 which is false and we know from our Boolean algebra that true and false evaluates to false therefore the second statement is also false so we continue and now we have 30 greater or equal than 25 which is true so we finally found a line which evaluates as true and that means that we return the value super and as you can see for Gandalf we have indeed gotten the value super let us look very quickly at one more example we get Legolas which is level 22 and so I will once again copy this whole thing and comment it and I will substitute 22 for every value of level cuz that’s the row we’re looking at and then looking at the first row 22 small than 15 is false so we proceed and then looking at the second row 22 bigger than 15 is true and 22 smaller than 25 is also true so we get true and true which evaluates to true and so we return mid and then looking at Legolas we get mid so this is how the case when statement Works in short for each row you insert the values that correspond to your Row in this case the value of level and then you evaluate each of these logical conditions in turn and as soon as one of them returns true then you return the value that corresponds to that condition and then you move on to the next row now I will clean this up a bit and now looking at this statement now and knowing what we know about the way way it works can we think of a way to optimize it to make it nicer to remove redundancies think about it for a minute now one thing we could do to improve it is to remove this little bit over here because if you think about it this part that I have highlighted is making sure that the character is not under 15 so that it can be classified as meat but actually we already have the first condition that makes sure that if the character is under 15 then the statement will output low and then move on so if the character is under 15 we will never end up in the second statement but if we do end up in the second statement we already know that the character is not under 15 this is due to the fact that case when proceeds condition by condition and exits as soon as the condition is true so effectively I can remove this part over here and then at the second condition only make sure that the level is below 25 and you will see if you run this that our bucketing system works just the same and the other Improvement that I can add is to replace this last line with an else CL Clause so the else Clause takes care of all the cases that did not meet any of the conditions that we specified so the case statement will go condition by condition and look for a condition that’s true but in the end if none of the conditions were true it will return what the else Clause says so it’s like a fallback for the cases when none of our conditions turned out to be true and if you look at our logic you will see that if this has returned false and this has returned false all that’s left is characters that have a level which is either 25 or bigger than 25 so it is sufficient to use an else and to call those super and if I run this you will see that our bucketing works just the same for example Gandalf is still marked as super because in the case of Gandalf this condition has returned false and this condition has returned false and so the else output has been written there now what do you think would happen if I completely removed the else what do you think would happen if I only had two conditions but it can be the the case that none of them is true what will SQL do in that case let us try it and see what happens so the typical response in SQL when it doesn’t know what to do is to select the null value right and if you think about it it makes sense because we have specified what happens when level is below 15 and when level is is below 25 but none of these are true and we haven’t specified what we want to do when none of these are true and because we have been silent on this issue SQL has no choice but to put a null value in there so this is practically equivalent to saying else null this is the default behavior for SQL when you don’t specify an else Clause now like every other piece of SQL the case statement is quite flexible for instance you are not forced to always create a text column out of it you can also create an integer column so you could Define a simpler leveling system for your characters by using one and two else three for the higher level characters and uh this of course will also work as you can see here however one thing that you cannot do is to mix types right because what this does is that it results in one column in a new column and as you know in SQL you’re not allowed to mix types between columns so always keep it consistent when it comes to typing and then when it comes to writing the when condition all the computational power of SQL is available so you can reference columns that you are not selecting you can run calculations as I am doing here and you can change logical statements right Boolean statements in complex ways you can really do anything you want although I generally suggest to keep it as simple as possible for your sake and the sake of the people who use your code and that is really all you need to know to get started with the case statement to summarize the case statement allows us to define a new columns whose values are changing conditional on the other values of my row this is also called conditional logic which means that we consider several conditions and then we do have different behaviors based on which condition is true and the way it works is that in the select statement when you are mentioning all your columns you create a new column which in our case is this one and you bookend it with a case and end and then between those you write your actual conditions so every condition starts with a when is followed by a logical statement which needs to evaluate to true or false and then has the keyword then and then a value and then the case when statement will go through each of these conditions in turn and as soon as one of them evaluates to true you will output the value that you have specified if none of the conditions evaluate to true then it will output the value that you specify in the else keyword and if the lse keyword is missing it will output null and so this is what you need to use the case statement and then experience and exercise and coding challenges will teach you when it’s the case to use it pun intended now where does the case statement fit in our logical order of SQL operations and the short answer is that it is defined here at the step when you are selecting your columns that’s when you can use the case when statement to create a new column that applies your conditional logic and this is the same as what we’ve shown in the lecture on SQL calculations you you can use select statement not only to get columns which already exist but to Define new columns based on calculations and logic now let us talk about aggregations which are really a staple of any sort of data analysis and an aggregation is a function that takes any number of values and compresses them down to a single informative value so I’m looking here at at my usual characters table but this is the version that I have in Google Sheets and as you know we have this level column which contains the level of each character and if I select this column in Google Sheets you will see that in the bottom right corner I can see here a number of aggregations on this column and like I said no matter how many values there are in the level columns I can use aggregations to compress them to one value and here you see some of the most important aggregations that you will work with some simply adding up all values together the average which is doing the sum and then dividing by the number of values the minimum value the maximum the count and the count numbers which is the same here so these are basically summaries of my column and you can imagine in cases where where you have thousands or millions of values how useful these aggregations can be for you to understand your data now here’s how I can get the exact same result in SQL I simply need to use the functions that SQL provides for this purpose so as you can see here I’m asking for the sum average minimum maximum and count of the column level and you can see the same results down here now now of course I could also give names to this column for example I could take this one and call it max level and in the result I will get a more informative column name and I can do the same for all columns now of course I can run aggregations on any columns that I want for example I could also get the maximum of experience and call this Max experience and I can also run aggregations on calculations that involve multiple columns as well as constants so everything we’ve seen about applying arithmetic and logic in SQL also applies now of course looking at the characters table we know that our columns have different data types and the behavior of the aggregate functions also is sensitive to the data types of the columns for example let us look at the many text columns that we have such as class now clearly not all of the aggregate functions that we’ve seen will work on class because how would you take the average of these values it’s not possible right however there are some aggregate functions that also work on strings so here’s an example of aggregate functions that we can run on a string column such as class first we have count which simply counts the total number of non null values and I will give you a bit more detail about the count functions soon then we have minimum and maximum now the way that strings are ordered in SQL is something called lexicographic order which is basically a fancy word for alphabetical order and basically you can see here that for minimum we get the text value that occurs earlier in uh alphabetical order whereas Warrior occurs last and finally here’s an interesting one called string EG and what this does is that this is a function that actually takes two arguments the first argument as usual is the name of the column and the second argument is a separator and what this outputs is now a single string a single piece of text where all of the other pieces of text have been glued together and then separated by this character that we specified over here which in our case is a comma Now if you go to the Google documentation you will find an extensive list of all the aggregate functions that you can use in Google SQL and this includes the ones that we’ve just seen such as average or Max as well as a few others that we will not explore in detail here so let us select one of them such as average and see what the description looks like now you can see that this function Returns the average of all values that are not null and don’t worry about this expression in an aggregated group for now just think about this as meaning all the values that you provide to the function all the values in the column now there is a bit about window functions which we will see later and here there are in the caveat section there are some interesting edge cases for example what happens if you use average on an empty group or if all values are null in that case it returns null and so on you could see what the function does when it finds these edge cases and here is perhaps the most important section which is supported argument types and this tells you what type of columns you can use this aggregation function on so you can see that you can use average on any numeric input type right any column that contains some kind of number and also on interval and interval we haven’t examined it in detail but this is actually a data type that specifies a certain span of time so interval could express something like 2 hours or 4 days or 3 months it is a quantity of time and finally in this table returned data types you can see what the average function will give you based on the data type that you insert so if you insert uh integer column it will return to you a float column and that makes sense because the average function involves a division and that division will usually give you floating Point values but for any other of the allowed input types such as numeric bit numeric and so on and these are all data types which represent numbers in B query the average function as you can see here will present Reserve that data type and finally we have some examples so whenever you need to use an aggregate function that is whenever you need to take many values a sequence of multiple values and compress them all down to one value but you’re not sure about which function to use or what the behavior of the function is you can come to this page and look up the functions that interest you and then read the documentation to see how they work now here’s an error that typically occurs when starting out with aggregations so you might say well I want to get the name of each character and their level but I also want to see the average of all levels and because I want to compare those two values I want to compare the level of my character with the average on all levels so I can write a query that looks like this right go to the Fant as a characters table and then select name level and then average level but as you can already see this query is not functioning it’s giving me an error and the error says that the select list expression references column name which is neither grouped nor aggregated so what does this actually mean to show you what this means I’ve gone back to my Google Sheets where I have the same data for my characters table and I have copy pasted our query over here now what this query does it takes the name column so I will copy paste it over here and then it takes the level column copy paste this here as well and then it computes the average over level now I can easily compute this with sheet formula by writing equal and then calling the function which is actually called average and then within the function I can select all these values over here and I get the average now this is the result that SQL computes but SQL is actually not able to return this result and the reason is that there are three columns but they have mismatch number of values specifically these two columns have 15 values each whereas this column has a single value and SQL is not able to handle this mismatch because as a rule every SQL query needs to return a table and a table is a series of columns where each column has the same number of values if that constraint is not respected you will get an error in SQL and we will come back to this limitation when we examine Advanced aggregation techniques but for now just remember that you can mix non-aggregated columns with other non-aggregated columns such as name and level and you can mix aggregated columns with aggregated columns such as average level with some level for example so I could simply do this and I would be able to return this as a table because as you can see there are two columns both columns have a single Row the number of rows matches and this is actually valid but you might ask can’t I simply take this value over here and just copy it in every row and until I make sure that average level has the same number of values as name and level and so return a table and respect that constraint indeed this is possible you can totally do this and then it would work and then this whole table would become a single table and you would be able to return this result however this requires the use of window functions which is a a feature that we will see in later lectures but yes it is totally possible and it does solve the problem now here’s a special aggregation expression that you should know about because it is often used which is the count star and count star is simply counting the total number of rows in a table and as you can see if I say from fantasy characters select count star I get the total count of rows in my results and this is a common expression used across all SQL systems to figure out how many rows a table has and of course you can also combine it with filters with the wear clause in order to get other types of measures for example I could say where is alive equals true and then the count would become actually the count of characters who are alive in my data so this is a universal way to count rows in SQL although you should know that if you’re simply interested in the total rows of a table and you are working with bigquery an easy and totally free way to do it is to go to the details Tab and look at the number of rows here so this was all I wanted to tell you about simp Le aggregations for now and last question is why do we call them simple simple as opposed to what I call them simple because the way we’ve seen them until now the aggregations take all of the values of a column and simply return One summary value for example the sum agregation will take all of the values of the level column and then return a single number which is the sum of all levels and more advanced aggregations involved grouping our data for example a question we might ask is what is the average level for Mages as opposed to the average level for Archers and for Hobbits and for warriors and so on so now you’re Computing aggregations not over your whole data but over groups that you find in your data and we will see how to do that in the lecture on groupi but for now you can already find out a lot of interesting stuff about your data by running simple aggregations let us now look at subqueries and Common Table expressions and these are two fundamental functionalities in SQL these functionalities solve a very specific problem and the problem is the following sometimes you just cannot get the result you require with a single query sometimes you have to combine multiple SQL queries to get where you need to go so here’s a fun problem that will illustrate my point so we’re looking at the characters table and we have this requirement we want to find all those characters whose experience is between the minimum and the maximum maximum value of our experience another way to say this we want characters who are more experienced than the least experienced character but less experienced than the most experienced character in other words we want to find that middle ground that is between the least and the most experienced characters so let us see how we could do that uh I have here A Simple Start where I am getting the name and experience column from the characters table now let us focus on the first half of the problem find characters who have more experience than the least experienced character now because this is a toy data set I can sort of eyeball it so I can scroll down here and I can see that the lowest value of experience is pipin with 2100 and so what I need to do now is to filter out from this table all the rows that have this level of experience but apart from eyeballing how would we find the lowest level of experience in our data if you thought of aggregate functions you are right so we have seen a in a previous lecture that we have aggregated functions that take any number of values and speed out a single value that’s a summary for example meing minum and maximum and indeed we need to use a function like that for this problem so your first instinct might be let us take this table and let us filter out rows in this way so let’s say where experience is bigger than the minimum of experience and on the surface this makes sense right I am using an aggregation to get the smallest value of experience and then I’m only keeping rows that have a higher value than that however as you see from this red line this actually does not work because it tells us aggregate function is not allowed in the work Clause so what is going on here so if you followed the lecture on aggregation you might have a clue as to why this doesn’t work but it is good to go back to to it and understand exactly what the problem is so I’m going back to my Google sheet over here where I have the exact same data and I copied our current query down here and now let’s see what happens when SQL tries to run this so SQL goes to the fantasy characters table and the Second Step In The Logical order as you remember is to filter it and for the filter it has to take the column of experience so let me take this column and copy it down here and then it has to compute minimum of experience right so I will Define this column here and I will use Google Sheets function to achieve that result so equals mean and then selecting the numbers and here I get the minimum value of experience and now SQL has to compare these column but this comparison doesn’t work right because these are two columns that have a different number of rows they have a different number of values so SQL is not able to do this comparison you cannot do an element by element comparison between a column that has 15 values and a column that has a single value so SQL throws an error but you might say wait there is a simple solution to this just take this value and copy it all over here until you have two columns of the same size and then you can do the comparison indeed that would work that’s a solution but SQL doesn’t do it automatically whereas if you work with other analytics tools such as pandas in python or npy you will find that um in a situation like this this would be done automatically this would be copied all over here and there’s a process called broadcasting for that but SQL does not take so many assumptions and so many risks with your data if it literally doesn’t work then SQL will not do it so hopefully now you have a better understanding of why this solution does not work so how could we actually approach this problem now a Insight is that I can run a different query so I will open this on the right to find out the minimum experience right I can go back to the characters table and I can select the minimum of experience this is simply what we’ve learned to do in the lecture on aggregations and I get the value here that is the minimum value of experience now that I know the minimum value of experience I could simply copy this value and insert it here into a wear filter and if I run this this will actually work it will solve my problem the issue of course is that I do not want to hard code this value first of all it is not very practical to run a separate query and copy paste the value in the code and second the minimum value might change someday and then I might not remember to update it in my code and then this whole query would become invalid to solve this problem I will use a subquery and I will simply delete the hardcoded value and I will open round brackets which is a way to get started on a subquery and I will take the query that I have over here and put them put it in the round brackets and when I run this I get the result that I need so what exactly is going on here we are using a subquery or in other words a query within a query so when SQL looks at this code it says all right so this is the outer query right and it has a inner query inside it a nested query so I have to start with the innermost query I have to start with the nested query so let me compute this and so SQL runs this query first and then it gets a value out of it which in our case we know that is 2100 and after that SQL substitutes this code over here by the value that was computed and we know from before that this works as expected and to compute the other half of our problem we want our character to have less experience than the most experienced character so this is just another condition in the wear filter and so I can add an end here and copy this code over here except that now I want my experience to be smaller than the maximum of EXP experience in my table now you might know this trick that if you select only part of your code like this and then you click run SQL will only execute that part of the code and so here we get the actual maximum for our experience and we can write it here in the comment and now we know that when SQL runs this query all of these will be computed to 15,000 and then experience will will be compared on that and the query will work as intended and here is the solution to our problem now here’s the second problem which shows another side of subqueries we want to find the difference between a character’s experience and their mentors so let us solve it manually for one case in the characters table so let us look at this character over here which is Saran with id1 and their experience is 8500 and then Saruman has character id6 as their Mentor so if I look for id6 we have Gandalf this is not very Canon compared to the story but let’s just roll with it and Gandalf has 10,000 of experience and now if we select the experience of Gandalf minus the experience of Saran we can see that there is A500 difference between their experience and this is what I want to find with my query now back to my query I will first Alias my columns in order to make them more informative and this is a great trick trick to make problems clearer in your head assign the right names to things so here instead of ID I will call this mentee ID and here I have Mentor ID and here instead of experience I will call this Mente experience so I have just renamed my columns now the missing piece of the puzzle is the mentor experience right so how can I get the mentor experience for example in the first case I know that character 11 is mentored by character 6 how can I get the experience of character six now of course I can take a new tab over here split it to the right go to Fantasy characters filter for ID being equal to six which is the ID of our mentor and get their experience and the experience in this case is 10,000 this is the same example that we saw before but now I would have to write this separate query for each of my rows so here six I’ve already checked but then I will need to check two and seven and one and this is really not feasible right and the solution of course is to solve it with a subquery so what I’m going to do here is open round brackets and in here I will write the code that I need and here I can simply copy the code that I’ve written here get experience from the characters where ID equals six now the six part is still hardcoded because in the first row Mentor ID is six to avoid hardcoding this part there are two components to this the first one is noticing that I am referencing the same table fantasy. characters in two different places in my code and this could get buggy and this could get confusing and the solution is to give separate names to these two instances now what are the right names to give so if we look at this outer query right here this is really information about the M te right because we have the Mente ID the ID of their mentor and the Mente experience so I can simply call this Mente table and as you can see I can Alias my table by simply writing it like this or I could also add the as keyword it would work works just the same on the other hand this table will give us the experience of the mentor this is really information about the mentor so we can call this Mentor table now we’re not going to get confused anymore because these two instances have different names and now what do we want this ID to be if we’re not going to hardcode it we want it to be this value over here we want it to be the mentor ID value from the Mente table we want it to be the M’s mentor and to refer to that column I will get the table name dot the column name so this is telling me get the mentor ID value from mentee table and now that I have the subquery which defines a colum with these two brackets I can Alias the result just like I always do and run this and now you will see after making some room here that we have successfully retrieved The Experience value for the mentor now I realize that this is not the simplest process so let us go back to our query over here and make sure that we understand exactly what is happening now first of all we are going to the characters table which contains information about our mentee the person who is being mentored and we label the table so that we remember what it’s about we filter it because we’re not interested in characters that do not have a mentor and then we’re getting a few data right the ID in this case represents the IDE of the mentee and we also have their Mentor ID and we also have the experience which again this is the table about the Mente represents the mentee experience now our goal is to also get the experience of their Mentor our goal is to see that we have a mentor id6 and we want to know that their experience is 10,000 and we do that with a subquery it’s a query within a query and in this subquery which is an independent piece of SQL code we are going back to the characters table but this is another instance of the table right that we’re looking at so to make sure we remember that we call this Mentor table because it contains information about the mentor and how do we make sure that we get the right value over here that we don’t get confused between separate mentors we make sure that for each row the ID of the character in this table is equal to the mentor ID value in the menty table in other words we make sure that we plug in this value over here in this case six into the table to get the right row and then from that row we get the experience value all of these code over here defines a new column which we call Mentor experience and this is basically the same thing that we did manually when we opened a table on the right and queried the table and copy pasted a hardcoded value this is just the way to do it dynamically with a subquery now we are not fully done with the problem right because we wanted to see the difference between the characters experience and their mentors so let’s see how to do this and the way to do it is with a column calculation just like the ones we’ve seen before so given that this column represents the mentor experience I can remove the Alias over here and over here as well and I can subtract the experience from this and a column minus a column gives me another column which I can then Alias as experience difference and if I I run this I will see the value that we originally computed manually which is the difference between the mentor and the Mente experience there’s nothing really new about this as long as you realize that this expression over here defines a column and this is the reference to a column and so you can subtract them and then give a name an alias to the result and now we can look at our two examples of nested queries side by side and we can figure out what they have in common and where do they differ so what they have in common is that they’re both problem that you cannot resolve with a simple query because you need to use values that you have to compute separately values that you cannot simply refer to by name like we usually do with our columns in this case on the left you need to know what are the minimum and maximum values for experience and in this case on the right you need to know what is the experience of a character’s mentor and so we solve that problem by writing a new query a nested query and making sure that SQL solves this query first gets the result and then plugs that result back back into the original query to get the data we need there is however a subtle difference between these two queries that turns out to be pretty important in practice and I can give you a clue to what this difference is by telling you that on the right we have something that’s called a correlated subquery and on the left we Define this as uncor related subquery now what does this really mean it means that here on the left our subqueries are Computing the minimum and the maximum experience and these are actually fixed values for all of our characters it doesn’t matter which character you’re looking at the whole data set has the same values from minimum experience and maximum experience so you could even imagine comp Computing these values first before running your queries for example you could say minimum experience is the minimum and maximum experience is the max and then you could imagine replacing these values over here right this will not actually work because you cannot Define variables like this in in SQL but on a logical level you can imagine doing this right because you only need to compute these two once I will revert this here so we don’t get confused on the other hand on the right you will see that the value that is returned by sub by this subquery needs to be computed dynamically for every row this value as you also see in the results is different for every row because every row references a different Mentor ID and so SQL cannot compute this one value here for for all rows at once it has to recompute it for every row and this is why we call it a correlated subquery because it’s connected to the value that is in each row and so it must run for each row and an important reason to distinguish between uncorrelated and correlated subqueries is that you can imagine that correlated subqueries are actually slow slower and more expensive to run because you have you’re running a SQL query for every row at least At The Logical level so this was our introduction to subqueries they allow you to implement more complex logic and as long as you understand it logically you’re off to a great start and then by doing exercises and solving problems you will learn with experience when it’s the case to use them in the last lecture we saw that we could use subqueries to retrieve singular values for example what is the minimum value of experience in my data set but we can also use subqueries and Common Table Expressions as well to create new tables all together so here’s a motivating example for that so what I’m doing in this query right here is that I am scaling the value of level based on the character’s class and you might need this in order to create some balance in your game or for whatever reason now what this does is that if the character is Mage the level gets divided by half or multiplied by 0.5 if the character is Archer or Warrior the level we take the 75% of it and in all other cases the level gains 50% so the details are not very important it’s just an example but the point is that we modify the value of level based on the character class and we do this with the case when statement that we saw in a previous lecture and as you can see in the results we get a new value of power level for each character that you can see here but now let’s say that I wanted to filter my my characters based on this new column of power level say that I wanted to only keep characters that have a power level of at least 15 how would I do that well we know that the wear filter can be used to filter rows so you might just want to go here and add a wear statement and say where power level is equal or bigger than 15 but this is not going to work right we know this cannot work because we know how the logical order of SQL operations works and so the case when column that we create power level is defined here at the select stage but the wear filter occurs here at the beginning right after we Source our table so due to our rules the wear component cannot know about this power level column that will actually get created later so the query that we just wrote actually violates the logical order of SQL operations and this is why we cannot filter here now there is actually one thing that I could do here to avoid using a subquery and get around this error and that’s something would be to avoid using this Alias power level that we assigned here and that the we statement cannot know about and replace it with the whole logic of the case when statement so this is going to look pretty ugly but I’m going to do it and if I run this you will see that we in fact get the result we wanted now in the wear lecture we saw that the wear Clause doesn’t just accept simple logical statements you can use all the calculations and all the techniques that are available to you at the select stage and you can also use case when statements and this is why this solution here actually works however this is obviously very ugly and impractical and you should never duplicate code like this so I’m going to remove this wear Clause over here and show you how you can achieve the same result with a subquery so let me first rerun this query over here so that you can see the results and now what I’m going to do I’m going to select this whole logic over here and wrap it in round brackets and then up here I’m going to say select star from and when I run this new query this data that I’m seeing over here should be unchanged so let us run it and you will see that the data has not changed at all but what is actually happening here well it’s pretty simple usually we say select star from fantasy characters right and by this we indicate the name of a table that our system can access but now instead of a table name we are showing a subquery and this subquery is a piece of SQL logic that obviously returns a table so SQL will look at this whole code and we’ll say say okay there is a outer query which is this one and there is an inner query a nested query which is this one so I will compute this one first and then I will treat this as just another table that I can then select from and now because this is just another table we can actually apply a wear filter on top of it we can say where power level is equal or greater than 15 and you will see that we get the result we wanted just like before but now our code looks actually better and the case when logic is not duplicated if you wanted to visualize this in our schema it would look something like this so the flow of data is the following first we run the inner query that works just like all the other queries we’ve seen until now it starts with the from component which gets the table from the database and then it goes through the usual pipeline of SQL logic that eventually produces a result which is a table next that table gets piped into the outer query the outer query also starts with the from component but now the from component is not redem directly from the dat database it is reading the result of the inner query and now the outer query goes through the usual pipeline of components and finally it produces a table and that table is our result and this process could have many levels of nesting because the inner query could reference another query which references another query and eventually we would get to the database but it could take many steps to get there and to demonstrate how multiple levels of nesting works I will go back to my query over here and I will go into my inner query which is this one and this is clearly referencing the table in the database but now instead of referencing the table I will reference yet an other subquery which can be something like from fantasy characters where is alive equals true select star so I will now run this and we have added yet another subquery to our code this was actually not necessary at all you could add the wear filter up here but it is just to demonstrate the fact that you can Nest a lot of queries within each other the other reason I wanted to show you this code is that I hope you will recognize that this is also not a great way of writing code it can get quite confusing and it’s not something that can be easily read and understood one major issue is that it interrupts the natural flow of reading code because you constantly have to interrupt a query because another nested query is beginning within it so you will read select start from and then here another query starts and this is also querying from another subquery and after reading all of these lines you will find this wear filter that actually refers to the outer query that has started many many lines back and if you find this confusing well I think you’re right because it is and the truth is that when you read code on the job or in the wild or when you see solutions that people propose to coding challenges unfortunately this is something that occurs a lot you have subqueries within subqueries within subqueries and very quickly the code becomes impossible to read fortunately there is a better way to handle this and a way that I definitely recommend over this which is to use common table Expressions which we shall see shortly it is however very important that you understand this way of writing subqueries and that you familiarize yourself with it because whether we like it or not a lot of code out there is written like this we’ve seen that we can use the subquery functionality to define a new table on the Fly just by writing some code a new table that we can then query just like any other SQL table and what this allows us to do is to run jobs that are too complex for a single query and to do that without defining new tables in our database and and storing new tables in our database it is essentially a tool to manage complexity and this is how it works for subqueries so instead of saying from and then the name of a table we open round brackets and then we write a independent SQL query in there and we know that every sqle query returns a table and this is the table that we can then work on what we do here is to select star from this table and then apply a filter on this new column that we created in the subquery power level and now I will show you another way to achieve the same result which is through a functionality called Common Table Expressions to build a Common Table expression I will take the logic of this query right here and I will move it up and next I will give a name to this table I will call it power level table and then all I need to say is with power level table as followed by the logic and now this is just another table that is available in my query and it is defined by the logic of what occurs Within the round brackets and so I can refer to this over here and query it just like I need and when I run this you see that we get the same results as before and this is how a Common Table expression works you start with the keyword with you give an alias to the table that you’re going to create you put as open round brackets write an independent query that will of course return a table under this alas over here and then in your code you can query this Alias just like you’ve done until now for any SQL table and although our data result hasn’t changed I would argue that this is a better and more elegant way to achieve the same result because we have separated in the code the logic for the these two different tables instead of putting this logic in between this query and sort of breaking the flow of this table we now have a much cleaner solution where first we Define the virtual table that we will need and by virtual I mean that we treat it like a table but it’s not actually saved in our database it’s still defined by our code and then below that we have the logic that uses this virtual table we can also have multiple Common Table expressions in our query let me show you what that looks like so in our previous example on subquery we added another part where here instead of querying the fantasy characters table we queried a filter on this characters table and it looked like this we were doing select star where is alive equals true so I’m just reproducing what I did in the previous lecture on subqueries now you will notice that this is really not necessary because all we’re doing here is add a wear filter and we could do this in this query directly but please bear with with me because I just want to show you how to handle multiple queries the second thing I want to tell you is although this code actually works and you can verify for yourself I do not recommend doing this meaning mixing Common Table expressions and subqueries it is really not advisable because it adds unnecessary complexity to your code so here we have a common table expression that contains a subquery and I will rather turn this into a situation where we have two common table expressions and no subqueries at all and to do that I will take this logic over here and paste it at the top and I will give this now an alias so I will call it characters alive but you can call it whatever is best for you and then I will do the keyword as add some lines in here to make it more readable and now once we are defining multiple Common Table Expressions we only need to do the with keyword once at the beginning and then we can simply add a comma and please remember this the comma is very important and then we have the Alias of the new table the as keyword and then the logic for that table all that’s needed to do now is to fill in this from because we took away the subquery and we need to query the characters alive virtual table here and this is what it looks like and if you run this you will get your result so this is what the syntax looks like when you have multiple Common Table Expressions you start with the keyword with which you’re only going to need once and then you give the Alias of your first table as keyword and then the logic between round brackets and then for every extra virtual table that you want to add for every extra Common Table expression you only need to add a comma and then another Alias the ask keyword and then the logic between round brackets and when you are done listing your Common Table Expressions you will omit the comma you will not have a comma here because it will break your code and finally you will run your main query and in each of these queries that you can see here you are totally free to query real tables you know material tables that exist in your database as well as common table Expressions that you have defined in this code and in fact you can see that our second virtual table here is quering the first one however be advised that the order in which you write these Common Table Expressions matters because a Common Table expression can only reference Common Table Expressions that came before it it’s not going to be able to see those that came after it so if I say here instead of from fantasy characters I try to query from power level table you will see that I get an error from bigquery because it thinks it doesn’t recognize it basically because the code is below so the order in which you write them matters now an important question to ask is when should I use subqueries and when should I use common table expressions and the truth is that they have a basically equivalent functionality what you can do with the subquery you can do with a common table expression my very opinionated advice is that every time you need to define a new table in your code you should use a Common Table expression because they are simpler easier to understand cleaner and they will make your code more professional in fact I can tell you that in the industry it is a best practice to use common table Expressions instead of subqueries and if I were to interview you for a data job I would definitely pay attention to this issue but there is an exception to this and this is the reason why I’m showing you this query which we wrote in a previous lect lecture on subqueries this is a query where you need to get a single specific value right so if you remember we wanted to get characters whose experience is above the minimum experience in the data and also below the maximum experience so characters that are in the middle to do this we need to dynamically find at any point you know when this query is being run what is the minimum experience and the maximum experience and the subquery is actually great for that you will notice here that we don’t really need to define a whole new table we just really need to get a specific value and this is where a subquery works well because it implements very simple logic and doesn’t actually break the flow of the query but for something more complex like power level table you know this specific query we’re using here which takes the name takes the level then applies a case when logic to level to create a new column called power level you could this do this with a subquery but I actually recommend doing it with a common table expression and this is a cool blog post on this topic by the company DBT it talks about common table expressions in SQL why they are so useful for writing complex SQL code and the best best practices for using Common Table expressions and towards the end of the article there’s also an interesting comparison between Common Table expressions and subqueries and you can see that of CTE Common Table expressions are more readable whereas subqueries are less readable especially if there there are many nested ones so you know a subquery within a subquery within a subquery quickly becomes unreadable recursiveness is a great advantage of CTE although we won’t examine this in detail but basically what this means is that once you define a Common Table expression in your code you can reuse it in any part of your code you can use it in multiple parts right you can use it in other CTE you can use it in your main query and so on on the other hand once you define a subquery you can really only use it in the query in which you defined it you cannot use it in other parts of your code and this is another disadvantage this is a less important factor but when you define a CTE you always need to give it a name whereas subqueries can be anonymous you can see it very well here we of course had to give a name to both of these CTE but the subqueries that we’re using here are Anonymous however I don’t I wouldn’t say that’s a huge difference and finally you have that CTE cannot be used in a work Clause whereas subqueries can and this is exactly the example that I’ve shown you here because this is a simple value that we want to use in our work clause in order to filter our table subqueries are the perfect use case for this whereas CTE are suitable for more complex use cases when you need to Define entire tables in conclusion the article says CTS are essentially temporary views that you can use I’ve used the term virtual table but temporary view works just as well conveys the same idea they are great to give your SQL more structure and readability and they also allow reusability before we move on to other topics I wanted to show you what an amazing tool to Common Table expressions are to create complex data workflows because Common Table expressions are not just a trick to execute certain SQL queries they’re actually a tool that allows us to build data pipelines within our SQL code and that can really give us data superpowers so here I have drawn a typical workflow that you will see in complex SQL queries that make use of Common Table Expressions now what we’re looking at here is a single SQL query it’s however a complex one because it uses CTE and the query is represented graphically here and in a simple code reference here the blue rectangles represent the Common Table Expressions these virtual tables that you can Define with the CTE syntax whereas the Red Square represents the base query the query at the bottom of your code that ultimately will return the result so a typical flow will look like this you will have a first Common Table expression called T1 that is a query that references a real table a table that actually exists in your data set such as fantasy characters and of course this query will do some work right it can apply filters it can calculate new columns and so on everything that we’ve seen until now and then the result of this query gets piped in to another Common Table expression this one is T2 that gets the result of whatever happen happened at T1 and then apply some further logic to it apply some more Transformations and then again the result gets piped into another table where more Transformations run and this can happen for any number of steps until you get to the final query and in the base query we finally compute the end result that will then be returned to the user so this is effectively a dat pipeline that gets data from the source and then applies a series of complex Transformations and this is similar to The Logical schema that we’ve been seeing about SQL right except that this is one level further because in our usual schema the steps are done by Clauses by these components of the SQL queries but here every step is actually a query in itself so of course this is a very powerful feature and this data pipeline applies many queries sequentially until it produces the final result and you can do a lot with this capability and also you should now be able to understand how this is implemented in code so we have our usual CTE syntax with and then the first table we call T1 and then here we have the logic within round brackets for T1 and you can see here that in the from we are referencing a table in the data set and then for every successive Common Table expression we just add a comma a new Alias and the logic comma new Alias and the logic and finally when we’re done we write our base query and you can see that the base query is selecting from T3 T3 is selecting from T2 T2 is selecting from T1 and T1 is selecting from the database but you are not limited to this type of workflow here is another maybe slightly more complex workflow that you will also see in the wild and here you can see that at the top we have two common table Expressions that reference the the database so you can see here like like the first one is getting data from table one and then transforming it the second one is getting data from table two and then transforming it and next we have the third CTE that’s actually combining data from these two tables over here so we haven’t yet seen how to combine data except through the union um I wrote The Joint here which we’re going to see shortly but all you need to know is that T3 is combining data from this these two parent tables and then finally the base query is not only using the data from T3 but also going back to T1 and using that data as well and you remember we said that great thing about ctes is that tables are reusable you define them once and then you can use them anywhere well here’s an example with T1 because T1 is defined here at the top of the code and then it is referenced by T3 but it is also referenced by the base query so this is another example of a workflow that you could have and really the limit here is your imagination and the complexity of your needs you can have complex workflows such as this one which can Implement very complex data requirements so this is a short overview of the power of CTE and I hope you’re excited to learn about them and to use them in your sequel challenges we now move on to joints which are a powerful way to bring many different tables together and combine their information and I’m going to start us off here with a little motivating example now on the left here I see my characters table and by now we’re familiar with this table so let’s say that I wanted to know for each character how many items they are carrying in their inventory now you will notice that this information is not available in the characters table however this information is available in the inventory table so how exactly does the inventory table works when you are looking at a table for the first time and you want to understand how it works the best question you can ask is the following what does each row represent so what does each row represent in this table well if we look at the columns we can see that for every row of this table we have a specific character id and an item id as well as a quantity and some other information as well such as whether the item is equipped when it was purchased and and so on so looking at this I realized that each row in this table represents a fact the fact that a character has an item right so I know by looking at this table that character id 2 has item 101 and character ID3 has item six and so on so clearly I can use this in order order to answer my question so how many items is Gandalf carrying to find this out I have to look up the ID of Gandalf which as you can see here is six and then I have to go to the inventory table and in the character id column look for the ID of Gandalf right now unfortunately it’s not ordered but I can look for myself here and I can see that at least this row is related to Gandalf because he has character id6 and I can see that Gandalf has item id 16 in his inventory and I’m actually seeing another one now which is this one which is 11 and I’m not seeing anyone uh any other item at the moment so for now based on my imperfect uh visual analysis is I can say that Gandalf has two items in his inventory of course our analysis skills are not limited to eyeballing stuff right we have learned that we can search uh a table for the information we need so I could go here and query the inventory table in a new tab right and I could say give me um from the inventory table where character id equals 6 this should give me all the information for Gandalf and I could say give me all the columns and when I run this I should see that indeed we have uh two rows here and we know that Gandalf has items 16 and 11 in his inventory we don’t know exactly what these items are but we know that he’s carrying two items so that’s a good start okay but uh what if I wanted to know which items Frodo is carrying well again I can go to the characters table and uh look up the name Frodo and I find out that Frodo is id4 so going here I can just plug that uh number into my we filter and I will find out that Frodo is carrying a single type of item which has id9 although it’s in a quantity of two and of course I could go on and do this for every character but it is quite impractical to change the filter every time and what if I wanted to know how many items each character is carrying or at least which items each character is carrying all at once well this is where joints come into play what I really want to do in this case is to combine these two tables into one and by bringing them together to create a new table which will have all of the information that I need so let’s see how to do this now the first question we must answer is what unites these two tables what connects them what can we use in order to combine them and actually we’ve already seen this in our example um the inventory table has a character id field which is actually referring to the ID of the character in the character’s table so we have two columns here the character id column in inventory and the ID column in characters which actually represent the same thing the identifier for a character and this logical connection the fact that these columns repres repr the same thing can be used in order to combine these tables so let me start a fresh query over here and as usual I will start with the from part now where do I want to get my data from I want to get my data from the characters table just as we’ve been doing until now however the characters table is not not enough for me anymore I need to join this table on the fantasy. inventory table so I want to join these two tables how do I want to join these two tables well we know that the inventory table has a character id column which is the same as the character tables ID column so like we said before these two columns from the different tables they represent the same thing so there’s a logical connection between them and we will use it for the join and I want to draw your attention to the notation that we’re using here because in this query we have two tables present and so it is not enough to Simply write the name of columns it is also necessary to specify to which table each column belongs and we do it with this notation so the inventory. character uh is saying that the we are talking about the character id colum in the inventory table and the ID column in the characters table so it’s important to write columns with this notation in order to avoid ambiguity when you have more than one table in your your query so until now we have used the from uh Clause to specify where do we want to get data from and normally this was simply specifying the name of a table here we are doing something very similar except that we are creating a new table that is obtained by combining two pre-existing tables okay so we are not getting our data from the characters table and we are not getting it from the inventory table but we are getting it from a brand new table that we have created by combining these two and this is where our data lives and to complete the query for now we can simply add a select star and you will now see the result of this query so let me actually make some room here and expand these results so I can show you what we got and as you can see here we have a brand new table in our result and you will notice if you check the columns that this table includes all of the columns from the characters table and also all of the columns from the inventory table as as you can see here and they have been combined by our join statement now to get a better sense of what’s Happening let us get rid of this star and let us actually select the columns that we’re interested in and once again I will write columns with this notation in order to avoid ambiguity and in selecting these columns uh I will remind you that we have all of the columns from the characters table and all of the columns from the inventory table to choose from so what I will do here is that I will take the ID columns from characters and I will take the name column from characters and then I will want to see the ID of the item so I will take the inventory table and the item id column from that table and from the inventory table I will also want to see the quantity of each item and to make our results clearer I will order my results by the characters ID and the item ID and you can see here that we get the result that we needed we have all of our characters here with their IDs and their name and then for each character we can tell which items are in their inventory so you can see here that Aragorn has item id4 in his inventory in quantity of two he also has Item 99 so because of this Aragorn has two rows if we look back at Frodo we see the uh information that we retrieved before and the same for Gandalf who has these two items so we have combined the characters table and the inventory table to get the information that we needed what does each row represent in our result well it’s the same as the inventory table each row is a fact which is that a certain character possesses a certain item but unlike the inventory table we now have all the information we want for a character and not just the ID so here we’ve uh we’re showing the name of each character but we could of course select more columns and get more information for each character as needed now a short note on notation when you see SQL code in the wild and u a query is joining on two or more tables people uh you know programmers were usually quite lazy and we don’t feel like writing the name of the table all all of the time right like we we’re doing in this case with characters so what we usually do is that we add an alias um on the table like this so from fantasy characters call it C we will join on inventory call it I and then basically we use this Alias um everywhere in the query both in the instructions for joining and in the column names and the same with characters so I will substitute everything here and and yes maybe it’s a bit less readable but it’s faster to write and we programmers are quite lazy so we’ll often see this notation and you will often also see that in the code we omit the as keyword which can be let’s say implicit in SQL code and so we write it like this from fantasy. character C join uh fantasy. inventory i and then C and I refer to the two tables that we’re joining and I can run this and show you that the query works just as well now we’ve seen why join is useful and how it looks like but now I want you to get a detailed understanding of how exactly the logic of join works and for this I’m going to go back to my spreadsheet and what I have here is my characters table and my inventory table these are just like you’ve seen them in big query except that I’m only taking um four rows each in order to make it simpler for the example and what you see here is the same query that I’ve just run on big query this is a t a query that takes the characters table joins it on the inventory table on this particular condition and then picks a few columns from this so let us see how to simulate this query in Google Sheets now the first thing I need to do is to build the table that I will run my query on because as we’ve said before the from part is now referencing not the characters table not the inventory table but the new table which is built by combining these two and so our first job is to build this new table and the first step to building this new table is to take all of the columns from characters and put them in the new table and then take all of the columns from inventory and then put them in the new table and what we’ve obtained here is the structure of our new table the structure of our new table is uh simply created by taking all of The Columns of the T table on the left along with all of the columns from the table on the right now I will go through each character in turn and consider the join condition the join condition is that the ID of a character is present in the character id column of inventory so let us look at my first character um we have Aragorn and he has ID one now is this ID present in the character id column yes I see it here in the first row so we have a match given that we have a match I will take all of the data that I have in the characters table for Aragorn and then I will take all of the data in the inventory table for the row that matches and I have built here my first row do I have any other Row in the inventory table that matches yes the second row also has a character id of one so because I have another match I will repeat the operation I will will take all of the data that I have in the left table for Aragorn and I will add all of the data from the right column in the row that matches now there are no more matches for id1 uh in the inventory table so I can proceed and I will proceed with Legolas he has character id of two question is there any row that has the value two in the character id column yes I can see it here so I have another match so just like before I will take the information for Legolas and paste it here and then I will take the matching row which is this one and paste it here we move on to gimly because there’s no other matches for Legolas now gimly has ID3 and I can see a match over here so I will take the row for gimly paste it here and then take the matching row character id 3 and paste it here great finally we come to Frodo character id for is there any match for this character I can actually find no match at all so I do nothing this row does not come into the resulting table because there is no match and this completes the job of this part of the query over here building the table that comes from joining these two tables this is my resulting table and now to complete the query I simply have to pick the columns that the query asks for so the First Column is character. ID which is this column over here so I will take it and I will put it in my result the second column I want is character. name which is this column over here the third column is the item id column which is this one right here and finally I have quantity which is this one right here and this is the final result of my query and of course this is just like any other SQL table so I can use all of the other things I’ve learned to run Logic on this table for example I might only want to keep items that are present in a quantity of two and so to do that I will simply add a wear filter here and I will refer uh the inventory table because that’s the parent table of the quantity column so I will say I will say i. quantity um bigger or equal to two and then how my query will work is that first it will build this table like we’ve seen so it will do this stage first and then it will run the wear filter on this table and it will only keep the rows where quantity is at least two and so as a result we will only get this row over here instead of this result that we see right here H except that um we will of course also have to only keep the columns that are specified in the select statement so we will get ID name um Item ID and quantity so this will be the result of my query after I’ve added a wear filter so let us actually take this and add it to B query and make sure that it works so so I have to add that after the from part and before the order by part right this is the order and after I run this I will see that indeed I get um Aragorn and Frodo is not exactly the same as in our sheet but that’s because our sheet has um less data but uh this is what we want to achieve and now let us go back to our super important diagram of the order of SQL operation and let us ask ourselves where does the join fit in in this schema and as you can see I have placed join at the very beginning of our flow together with the from because the truth is that the joint Clause is not really separate from the from CL Clause they are actually one and the same component in The Logical order of operations so as you remember the first stage specifies where our data lives where we do we want to get our data from and until now we were content to answer this question with a single table name with the address of a single table because all the data we needed was in just one table and now instead of doing this we are taking it a step further we are saying our data lives in a particular combination of two or more tables so let me tell you which tables I want to combine and how I want to combine them and the result of this will be of course yet another table and then this table will be the beginning of my flow and after that I can apply all the other operations that I’ve come to know uh on my table and it will work just like U all our previous examples the result of a join is of course just another table so when you look at a SQL query and this query includes a join you really have to see it as one and the same with the front part it defines the source of your data by combining tables and everything else that you do will be applied not to a single table not to any of the tables that you’re combining everything that you do will be applied to the resultant table that comes from this combination and this is why from and join are really the same component and this is why they are the first step in The Logical order of SQL operations let us now briefly look at multiple joints because sometimes the data that you need is in three tables or four tables and you can actually join as many tables as you want uh or at least as many tables as your system uh allows you to join before it becomes too slow so we have our example here from before we have each character and we have their name and we know which items are in their inventory but we actually don’t know what the items are we just know their ID so how can I know uh that if Aragorn has item four what item does Aragorn actually have what is the name of this item now obviously this information is available in the items table that you have here on the right and you can see here that we have a name column and just like before I can actually eyeball it I can look for it myself I know that I’m looking for item id 4 and if I go here and uh I go to four I can see that this item is a healing potion and now let us see how we can add this with the join so now I will go to my query and after joining with characters in inventory I will take that result and simply join it on a third table so I will write join on fantasy. items and I can call this it to use a uh brief form uh because I am lazy as all programmers are and now I need to specify the condition on which to join so the condition is that the item ID column which actually came from the inventory table right that’s its parent so I’m going to call it inventory. item um ID except that yeah I’m referring to inventory as a simple I that is the brief form is the same as the items table the ID column in the items table and now that I’ve added my condition the data that I’m searcing is now a combination of these three tables and in my result I now have access to The Columns of the items table and I can access these columns simply by referring to them so I will say it. name and some other thing it. power and after I run this query I should be able for each item to see the name and the power right so Aragorn has a healing potion with power of 50 Legolas has a Elven bow with power of 85 and so on now you may have noticed something a bit curious and it’s that name here is actually written as name1 and can you figure out why this is happening well well it’s happening because there’s an ambiguity right the characters table has a column called name and the items table also has a column called name and because bigquery is not referring to the columns the way we are doing it right by saying the the parent table and then the name of the column it uh it would find itself in a position of having two identically named columns so the second one uh it tries to distinguish it by adding underscore one and how we can remedy this is by renaming the column to something more meaningful for example we could say call this item name which would be a lot clearer for whoever looks at the result of our query and as you can see now the name makes more sense so you can see that the multiple join is actually nothing new because when we join the first time like we did before we have combined two two tables into a new one and then this new table gets joined to a third table so it’s simply repeating the join operation twice it’s nothing actually new but let us actually simulate a multiple join in our spreadsheet to make sure that we understand it and that it’s nothing new so again I have our tables here but I have added the items table which we will combine and I’ve written here our query right so take the characters table and join it with inventory uh like we did before and then take the result of that table and join it to items and here we have the condition so the first thing we need to do is to process our first join and this is actually exactly what we’ve done before so let us do it again first of all the combined table uh characters and inventory its structure is obtained by taking all the columns of characters and then all the columns of inventory and putting them side by side and this is the result table now for the logic of this table I will now do it faster because we’ve done it before but basically we get the first character id1 it has two matches so I’ll actually take this values and put them into two rows and for the inventory part I will simply call copy these two rows to um complete my match then we have Legolas there is one match here so I will take the left side and I will take so I’m looking for id2 so I will take this row over here that’s all we have and then we have gimle and he also has one match so I’ll will take it here and the resulting column and then finally Frodo has no match so I will not add him to my result this is exactly what we’ve done before so now that we have this new table we can proceed with our next join which is with items okay so the resulting table will be the result of our first join combined with items and to show you that we’ve already computed uh this and now it’s one table I have added round brackets now the rules for joining are just the same so take all of the columns in the left side table and then take all of the columns in the right side table and now we have the resulting structure of our table and then let us go through every row so let us look at the first row what does the joint condition say Item ID needs to be in the ID table of items so I can see a match here so I will simply take this row on the left side and the matching row on the right side and add it here second row the item ID is four do I have a match yes I can see that I have a match so I will paste the row on the left and the mat matching row on the right third column item id 2 do I have a match no I don’t so I don’t need to do anything and in the final row item id 101 I don’t see a match so I don’t have to do anything and so this is my final result in short multiple join works just like a normal join combine the first two tables get the resulting table and then keep doing this until you run out of joins now there’s another special case of join uh which is the self join and this is something that people who are getting started with SQL tend to find confusing but I want to show you that there’s nothing uh confusing about it because really it’s just a regular join that works just like all the other joints that we’ve seen there’s nothing actually special about it so we can see here uh the characters table and you might remember that for each character we are we have a column of Mentor ID now in a lot of cases this column has value null so it means that there’s nothing there but in some cases there is a value there and what this means is that this particular character so we are looking at number three uh that is Saruman uh this particular character has a mentor and who is this Mentor uh all we know is that their ID is six and it turns out that the ID in this column is referring to the ID in the characters table so to find out who six is I just have to look who has an ID of six and I can see that it is Gandalf so by eyeballing it I know that San has a mentor and that Mentor is Gandalf and then elron also has the same Mentor which is Gand so I can solve this by eyeballing the table but how can I get a table that shows for each character who has a mentor who their Mentor is it turns out that I have to take the character’s table and join it on the characters table on itself so let’s see how that works in practice so let me start a new query here on the right and so my goal here is to list every character in the table and then to also show their Mentor if they have one so I will of course have to get the characters table for this and the first time I take this table it is simply to list all of the characters right so to remind myself of that I can give it a label which is chars now as you know each character has a mentor ID value and but to find out who like what is the name of this Mentor I actually need to look it up in the characters table so to do this I will join on another instance of the characters table right this is another let’s say copy of the same data but now I’m going to use it for a different purpose I will not use it to list my characters I will use it to get the name of the mentor so I will call this mentors to reflect this use now what is The Logical connection between these two copies of the characters table each character in my list of characters has a mentor ID field and I want to match this on the the ID field of my mentor table so this is The Logical connection that I’m looking for and I can now add a select star to quickly complete my query and see the results over here so the resulting table has all of The Columns of the left table and all of The Columns of the right table which means that the columns of the characters table will be repeated uh twice in the result as you can see here but on the left I simply have my list of characters okay so the first one is Saruman and then on the right I have the data about their Mentor so Saran has a mentor ID of six and then here starts the data about the mentor he has ID of six and his name is Gandalf so you can see here that our self jooin has worked as intended but this is actually a bit messy uh we don’t need uh all of these columns so let us now select Only The Columns that we need so from my list of characters I want the name and then from the corresponding Mentor I also want the name and I will label these columns so that they make sense to whoever is looking at my data so I will call this character character name and I will call this Mentor name and when I run this query you can see that quite simply we get what we wanted we have the list of all our characters at least the ones who have a mentor and for each character we can see the name of their Mentor so a self join works just like any other join and the key to avoiding confusion is to realize that you are joining on two different copies of the same data okay you’re not actually joining on the same exact table so one copy of fantasy characters we call characters and we use for a purpose and then a second copy we call mentors and we use for another purpose and when you realize this you see that you are simply joining two tables uh and all the rules that you’ve learned about normal joints apply it just so happens that in this case the two tables are identical because you’re getting the data from the same source and to drive the point home let us quickly simulate this in our trusty spreadsheet and so as you can see here uh I have the query that I’ve run in B query and we’re now going to simulate it so the important thing to see here is that that we’re not actually joining one table to itself although that’s what it looks like we’re actually joining two tables which just happen to look the same okay and so one is called chars and one is called mentors based on the label that we’ve given them but then once we join them the rules are just the same as we’ve seen until now so to create the structure of the resulting table take all the columns from the left left and then take all the columns from the right and then go row by row and look for matches based on on the condition now the condition is that Mentor ID in chars needs to be in the ID column of mentors so first row Aragorn has Mentor 2 is this in the ID column yes I can see a match here so let me take all the values from here and all the values from the matching rows paste them together are there any other matches no second row we’re looking for Mentor ID 4 do we have a match yes I can see it here so let me take all of the values from the left and all of the values from the matching row on the right now we have two more rows but but as you can see in both cases Mentor ID is null which means that they have no mentor and basically for the purposes of the join we can ignore these rows we are not going to find a match in these rows in fact as an aside even if there was a character whose ID was null uh we wouldn’t match with Mentor ID null on a character whose ID was null because in squl in a sense null does not equal null because null is not a specific value but it represents the absence of data so in short when Mentor ID is null we can be sure that in this case uh there will be no match and the row will not appear in the join now that we have our result we simply need to select the columns that we want and so the first one is name which comes from the charge table which is this one over here and the second one is name that comes from the mentor table which is this one over here and here is our result so that’s how a self join works so until now we have seen uh joint conditions which are pretty strict and and straightforward right so there’s a column in the left table and there’s a column in the right table and they represent the same thing and then you look for an exact match between those two columns and typically they’re an ID number right so one table has the item id the other table also has the item ID and then you look for an exact match and if there’s an exact match you include the row in the join otherwise not that’s pretty straightforward but what I want to show you here is that the join is actually much more flexible and and powerful than that and you don’t always need you know two columns that represent the exact same thing or an exact match in order to write a joining condition in fact you can create your own you know complex conditions and combinations that decide how to join two tables and for this you can simply use the Boolean algebra magic that we’ve learned about in this course and that we’ve been using for example when working on the wear filter so so let us see how this works in practice now I’ve tried to come up with an example that will illustrate this so let’s say that we have a game you know board game or video game or whatever and we have our characters and we have our items okay and in our game um a character cannot simply use all of the items in the world okay there is a limit to which items a character can use and a limit is based on the following rule um let me write it here as a comment and then we will uh use it in our logic so a character can use any item for which the power level is equal or greater than the characters experience divided by 100 okay so this is just a rule uh that exists in our game and now let us say that we wanted to get a list of all characters and the items that they can use okay and this is clearly uh a case where we would need a join so let us actually write this query I will start by getting my data from fantasy. characters and I will call this c as a shorthand and I will need to join on the items table right and what is the condition of the join the condition of the join is that the character’s experience divided by 100 is greater or equal than the items power level and I forgot here to add a short hand I for the items table so this is the condition that refects our Rule and out of this table that I’ve created I would like to see the characters name and the characters experience divided by 100 and then I would like to see the items name and the items power to make sure that my um join is working as intended so let us run this and look at the result so this looks a bit weird because we haven’t given a label to this column but basically I can see um that I have Gandalf and his experience divided by 100 is 100 and he can wear the item Excalibur that has a power of 100 which satisfies our condition let me actually order by character name so that I can see in one place all of the items that a character can wear so we can see that Aragorn is first and his experience divided by 100 is 90 and then uh this is the same in all all of these rows that we see right now but then we see all of the items that Aragorn is allowed to use and we see their power and in each case you will see that their power does not exceed this value on the left so the condition uh that we wrote works as intended so as you can see what we have here is a Boolean expression just like the ones we’ve seen before which is a logical statement that eventually if you run it it evaluates to either true or false and all of the rules that we’ve seen for Boolean Expressions apply here as well for example I can decide that this rule over here does not apply to Mages because Mages are special and then I can say that if a character is Mage then I want them to be able to use all of the items well how can I do this in this query can you pause the video and figure it out so what I can do is to Simply expand my Boolean expression by adding an or right and what I want to test for is that character class equals Mage so let me check for a second that I have class and I have Mage so this should work and if I run this going through the result I will not do it but you can uh do it yourself and and verify for yourself that if a character is a Mage you will find out that they can use all of the items and this of course is just a Boolean expression um in which you have two statements connected by an or so if any of this is true if at least one of these two is true then the whole statement will evaluate to true and so the row will match if you have trouble seeing this then go back to the video on the Boolean algebra and uh everything is explained in there so this is just what we did before when we simulated The Joint in the spreadsheet you can imagine taking the left side table which is uh characters and then going row by row and then for the first row you check all of the rows in the right side table which is items all of the rows that have a match but this time you won’t check if the ID corresponds you will actually run this expression to see whether there is a match and when this expression evaluates as true you consider that to be a match and you include the row in the join however if this condition does not evaluate to true it’s not a match and so the row is not included in the join so this is simply a generalization from the exact match which shows you that you can use any conditions in order to join uh two tables now I’ve been pretending that there is only one type of join in SQL but that is actually not true there are a few different types of join that we need to know so let us see uh what they are and how they work now this is the query that we wrote before and this is exactly how we’ve written it before and as you can see we’ve simply specified join but uh it turns out that what we were doing all the time was something called inner join okay and now that I’ve written it explicitly you can see that if I rerun the query I will get exactly the same results and this is because the inner join is by far the most common type of join that you find in SQL and so in many uh styles of SQL such as the one used by bigquery they allow you to skip this specification and they allow you to Simply write join and then it is considered as an inner join so when you want to do an inner join you have the choice whether to specify it explicitly or to Simply write join but what I want to show you you now is another type of join called Left join okay and to see how that works I want to show you um how we can simulate this query in the spreadsheet so as you can see this is very similar to what we’ve done before I have the query uh that I want to simulate and notice the left join and then I have my two tables now what is the purpose of the left join in the previous examples which were featuring the inner join we’ve seen that when we combine two tables with an inner join the resulting table will only have rows that have a match in both tables okay so what we did is that we went through every Row in the characters table and if it had a match in the inventory table we kept that row but if there was no match we completely discarded that row but what if we wanted in our resulting table to see all of the characters to make sure that our list of characters was complete regardless of whether they had a match in the inventory table this is what left join is for left join exists so that we can keep all of the rows in the left table whether they have a match or not so let us see that in practice okay so when we need to do a left join between characters and inventory so first of all I need to determine the structure of the resulting table and to do this I will take all of the columns from the left table and all of the columns from the right table nothing new there next step let us go row by Row in the left table and look for matches so we have Aragorn and he actually has two matches uh by now we’ve uh remembered this so these two rows have a match in character id with the ID of characters so I will take these two rows and add them to my resulting table next is Legolas and I see a match here so I will take the rows where Legolas matches and put it here it’s only one row actually gimly has also a single match so I will create the row over here um and so this is the match for gimly and of course I can ensure that I’m doing things correctly by looking at this ID column and uh this character id column over here and they have to be identical right if they’re not then I’ve made a mistake and finally we come to Frodo now Frodo you will see does not have a match in this table so before we basically discarded this row because it had no match right now though we are dealing with the left join that means that all of the rows in the characters table need to be included so I don’t have a choice I need to take this row and include it and add it here and now the question is what values will I put in here well I cannot put any value from the inventory table because I don’t have a match so the only thing that I can do is to put NS in here NS of course represent the absence of data so they’re perfect for this use case and that basically completes uh the sourcing part of our left join now you may have noticed that there is an extra row here in inventory which does not have a match right it is referred into character id 10 but there is no character id 10 so here the frao row also did not have a match but we included it so should we include this row as well the answer is no why not because this is a left joint okay so left joint means that we include all of the rows in the left table even if they don’t have a match but we do not include rows in the right table when they do not have a match okay this this is why it’s a left join so but if you’re still confused about this don’t worry because it will become clearer once we see the other types of join and of course for the sake of completeness I can actually finish the query by selecting my columns which would be the uh character id and the character name and the item ID and the item quantity and this is my final result and in the case of Frodo we have null values which tells us that this row found no match in the right table which in this case means that Frodo does not have any items now that you understand the left join you can also easily understand the right joint it is simply the symmetrical operation to the left joint right right so whether you do characters left joint inventory or you do inventory right join characters the result will be identical it’s just the symmetrical operation right this is why I wrote here that table a left joint b equals table B right joint a so hopefully that’s pretty intuitive but of course if I I did characters right join inventory then the results would be reversed because I would have to keep all of the rows of inventory regardless of whether they have a match or not and only keep rows in characters which have a match so if you experiment for yourself on the data you will easily convince yourself of this result let us now see the left joint in practice so remember the query from before um where we take each character and then we see their Mentor this is the code exactly as we’ve written it before and so now you know that this is an inner join because when you don’t specify what type of join you want SQL assumes it’s an inner join at least that’s what the SQL in bigquery does and you can see that if I write inner join um I think I have a typo there uh the result is absolutely identical and in this case we’re only including characters who have a mentor right we are missing out on characters who don’t have a mentor meaning that Mentor ID is null because in the inner join there is no match and so they are discarded but what would happen if I went here and instead turn this into a left join what I expect to happen is that I will keep all of my characters so all of the rows from the left side table regardless of whether they have a match or not regardless of whether they have a mentor or not and so let us run this and let us see that this is in fact the case I now have a row for each of my characters and I have a row for Gandalf even though Gandalf does not have mentor and so I have a null value in here so the left join allows me to keep all of the rows of the left table now we’ve seen the inner join the left join and the right join which are really the same thing just symmetrical to each other and finally I want to show you the full outer join this is the last type of join that I want to that I want to show you now you will see that a full outer joint is like a combination of all of the joints that we’ve seen until now so a full outer join gives us all of the rows uh that have a match in the two tables plus all of the rows in the left table that don’t have a match with the right table plus all of the rows in the right table that don’t have a match in the left table so let us see how that works in practice what I have here is our usual query but now as you can see I have specified a full outer join so let us now simulate this join between the two tables now the first step as usual is to take all of the columns from the left table and all of the columns from the right table to get the structure of the resulting table and now I will go row by Row in the left table so as usual we have Aragorn and you know what I’m already going to copy it here because even if there’s not a match I still have to keep this row uh because this is a full outer joint and I’m basically not discarding any row now that I’ve copied it is there a match well I already know from the previous examples that there are two rows uh in the inventory table that match because they have character id one so I’m just going to take them and copy them over here and in the second row I will need to replicate these values perfect let me move on to Legolas and again I can already paste it because there’s no way that I’m going to discard this row but of course we know that Legolas has a m match and moving quickly cuz we’ve already seen this gimly has a match as well and now we come to Frodo now Frodo again I can already copy it because I’m keeping all the rows but Frodo does not have a match so just like before with the left join I’m going to keep this row but I’m going to add null values in the columns that come from the invent table so now I’ve been through all of the rows in the left table but I’m not done yet with my join because in a full outer join I have to also include all of the rows from the right table so now the question is are there any rows in the inventory table that I have not considered yet and for this I can check the inventory ID from my result 1 2 3 4 and compare it with the ID from my table 1 2 3 4 5 and then I realize that I have not included row number five because it was not selected by any match but since this is a full outer join I will add this row over here I will copy it and of course it has no correspondent uh in the left table so what do I do once again I will insert null values and that completes the first phase of my full outer join the last phase is always the same right pick the columns that are listed in the select so you have the ID the name Item ID and quantity and this completes my full outer join so remember how I said that a full outer join is like an inner join plus a left join plus a right join here is a visualization that demonstrates now in the result the green rows are the rows in which you have a match on the left table and the right table right and these rows correspond to the inner join and if you run an inner join this this will be the only rows that are returned right now the purple row is including a row that is present in the left table but does not have any match in the right table so if you were to run a left join what would the result be a left joint would include all of the green rows because they have a match and and additionally they would also include the purple row because in the left joint you keep all of the rows from the left if on the other hand you were to run a right join and you wouldn’t like swap the names of the tables or anything right you would do characters right join inventory you would get of course all of the green rows because they are a match Additionally you would get the blue row at the end because this row is present in the right table even though there’s no match and in the right join we want to keep all the rows that are in the right table and finally in a full outer join you will include all of these rows right so first of all all of the rows that have a match and then all of the rows in the left table even though they don’t have a match and finally all of the rows in the right table even though they don’t have a match and these are the three or four types of joint that you need to know and that you will find useful in solving your problems now here’s yet another way to think about joints in SQL and to visualize joints which you might find helpful so one way to think about SQL tables is that a table is a set of rows and that joints correspond to different ways of uh combining sets and you might remember this from school this is a v diagram it represents the relation uh between uh two sets and the elements that are inside these two sets so you can take set a to be our left table uh containing all of the rows from um the left table and set B to be our right table with all of the rows from the right table and in the middle here you can see that there is an intersection between the sets this intersection represents the rows that have a match uh so this would be the rows that I have colored green in our example over here so what will happen if I select if I want to see only the rows that are a match only the rows that belong in both tables let me select this now and you can see that this corresponds to an inner joint because I only want to get the rows that have a match then what would happen if I wanted to include all of the rows in the left table regardless of whether they have a match or not to what type of join does that correspond I will select it here and you can see that that corresponds to a left join the left join produces a complete set of records from table a with the matching records in table B if there is no match the right side will contain null likewise if I wanted to keep all of the rows in uh table B including the ones that match with a I would of course get a right join which is just symmetrical to a left join finally what would I have to do to include all of the rows from both tables regardless of whether they have a match or not if I do this then I will get a full outer join so this is just one way to visualize what we’ve already seen there is one more thing you can actually realize from this uh tool which is in some cases you might want to get all of the records that are in a except those that match in B so all of the record that records that a does not have in common with b and you can see how you can actually do this this is actually a left join with an added filter where the b key is null so what does that mean the meaning will be clear if I go back to our example for the left join you can see that this is our result for the left join and because Frodo had no match in the right table the ID column over here is null so if I take this table and I apply a filter where ID where inventory ID is null I will only get this result over here and this is exactly the one row in the left table that does not have a match in the right table so this is more of a special case you don’t actually see this a lot in practice but I wanted it wanted to show it briefly to you in case you try it and get curious about it likewise the last thing that you can do you could get all of the rows from A and B that do not have a match so the set of Records unique to table a and table B and this is actually very similar you do a full outer join and you check that either key is null so either inventory ID is null or character id is null and if you apply that filter you will get these two rows which is the set of rows that are in a and only in a plus the rows that are in B and only in B once again I’ve honestly never used this in practice I’m just telling you for the sake of completeness in case you get curious about it now a brief but very important note on how SQL organizes data so you might remember from the start of the course that I’ve told you that in a way SQL tables are quite similar to spreadsheet tables but there are two fundamental difference one difference is that each SQL table has a fixed schema meaning we always know what the columns are and what type of data they contain and we’ve seen how this works extensively the second thing was that SQL tables are actually connected with each other which makes SQL very powerful and now we are finally in a position to understand just exactly how SQL tables can be connected with each other and this will allow you to understand how SQL represents data so I came here to DB diagram. which is a very uh nice website for building representations of SQL data and this is uh this type of um of chart of representation that we see here is also known as ER as you can see me writing here which is stands for entity relationship diagram and it’s basically a diagram that shows you how your data is organized in your SQL system and so you can see a representation of each table uh this is the example that’s shown on the web website and so you have three tables here users follows and posts and then for each table you can see the schema right you can see that the users table has four columns one is the user ID which is an integer the other is the username which is varar this is another way of saying string so this is a piece of text rooll is also a piece of text and then you have a Tim stamp that shows when the user was created and the important thing to notice here is that these tables are actually they’re not they don’t exist in isolation but they are connected with each other they are connected through these arrows that you see here and what do these arrows represent well let’s look at the follows table okay so each row of this table is a fact shows that one user follows another and so in each row you see the ID of the user who follows and the ID of the user who is followed as well as the time when this event happened and what are these uh arrows telling us they’re telling us that the IDS in this table are the same thing as the user ID column in this table which means that you can join the follows table with the users table to get the information about the two users that are here the user who is following and the user who is followed so like we’ve seen before a table has a column which is the same thing as another tables column which means that you can join them to combine their data and this is how in SQL several tables are connected with each other they are connected by logical correspondences that allow you to join those tables and combine their data likewise you have the post table and each row represent a post and each post post has a user ID and what this arrow is telling you is that uh you can join on the user table using this ID to get all the information you need about the user who has created this post now of course as we have seen you are not limited to joining the tables along these lines you can actually join these tables on whatever condition you can think of but this is a guarantee of consistency between these tables that comes from how the data was distributed and it’s a guarantee it’s a promise that you can get the data you need by joining on these specific columns and that is really all you need to know in order to get started with joints and use them to explore your data and solve SQL problems to conclude this section I want to go back to our diagram and to remind you that from and join are really one and the same they are the way for you to get the data that you need in order to answer your question and so when the data is in one table alone you can get away with just um using the from and then specifying the name of the table but often your data will be distributed in many different tables so you can look at the ER diagram such as this one if you have it to figure out how your uh data works and then once you decided which tables you want to combine you can write a from which combines with a join and so create a new table uh which is a combination of two or more tables and then all of the other operations that you’ve learned will run on top of that table we are finally ready for a in-depth discussion of grouping and aggregations in SQL and why is this important well as you can see I have asked Chad GPT to show me some typical business questions that can be answered by data aggregation so let’s see what we have here What’s the total revenue by quarter how many units did did each product sell last month what is the average customer spent per transaction which region has the highest number of sales now as you can see these are some of the most common and fundamental business questions um that you would be asking when you do analytics and this is why grouping and aggregation are so important when we talk about SQL now let’s open our date once again in the spreadsheet and see what we might achieve through aggregation so I have copied here four columns from my characters table Guild class level and experience and I’m going to be asking a few questions the first question which you can see here is what are the level measures by class so what does this mean well earlier in the course we looked at aggregations and we call them simple aggregations because we were running them over the whole table so you might remember that if I select the values for level here I will get a few different aggregations in the lower right of my screen so what you can see here is that I have a count of of 15 which means that there are 15 rows for level and that the maximum level is 40 the minimum is 11 and then I have an average level of 21.3 more or less and if you sum all the levels you get 319 so this is already some useful information but now I would like to take it a step further and I would like to know this aggregate value within each class so for example what is the maximum level for warriors and what is the maximum level for Hobbits are they different how do they compare this is where aggregation comes into play so let us do just that now let us find the maximum level Within each class and let us see how we might achieve this now to make things quicker I’m going to sort the data to fit my purpose so I will select the range over here and then go to data sort range and then in the in the advanced options I will say that I want to sort by column B because that’s my class and now as you can see the data is ordered by class and I can see the different values for each class next I will take all the different values for class and separate them just like this so first I have Archer then I have hobbit then I have Mage and finally I have Warrior so here they are they’re all have their own sp right now finally I just need to take to compress each of these ranges so that each of them covers only one row so for Archer I will take the value of the class Archer and then I will have to compress these numbers to a single number and to do that I will use the max function this is the aggregation function that we are using and quite intuitively this function will look at the list of values we’ll pick the biggest one and it will reduce everything to the biggest value and you can also see it here in this tool tip over here doing the same for Hobbit compress all of the values to a single value and then compress all of the numbers to a single number by applying a an aggregation function so I’ve gone ahead and done the same for mage and Warrior and all that’s left to do is to take this and bring all these rows together and this is my result this is doing what I have asked for I was looking to find the maximum level Within each class so I have taken all the unique values of class and then all the values of level within each class I have compressed them to a single number by taking the maximum and so here I have a nice summary which shows me what the maximum level is for each class and I can see that mes are much more powerful than everyone and that Hobbits are much more weaker according to this measure I’ve learned something new about my data now crucially and this is very important in my results I have class which is a grouping field and then level which is an aggregate field okay so what exactly do I mean by this now class is a grouping field because it divides my data in several groups So based on the value of class I have divided my data as you see here so Archer has three values Hobbit has four values and so on level is an aggregate field because it was obtained by taking a list of several values so here we have three here we have four and in the wild we could have a thousand or 100 thousand or Millions it doesn’t matter it’s a list of multiple values and then I’ve taken these values and compressed them down to one value I have aggregated them down to one value and this is why level is an aggregate field and whenever you work with groups and aggregations you always have this division okay you are have some fields that you use for grouping you know for subdividing your data and then you have some fields on which you run aggregations and aggregations such as for example looking at a list of value and taking the maximum value or the average or the minimum and so on aggregations are what allow you to understand the differences between groups so after aggregating you can say oh well the the Mages are certainly much more powerful than the hobbits and so on and if you look work with the dashboards like Tableau or other analytical tools you will see that another way to refer to these terms is by calling the grouping Fields dimensions and the aggregate Fields measures okay so I’m just leaving it here you can say grouping field and aggregate field or you can talk about dimensions and measures and they typically refer to the same type of idea now let’s see how I can achieve the same result in SQL so I will start a new query here and I want to get data from fantasy. characters and after I’ve sourced this table I want to Define my groups okay so I will use Group by which is my new clause and then here I will have to specify the grouping field I will have to specify the group that I want to use in order to subdivide the data and that group is class in this case after that I will want to define the columns that I want to see in my result so I will say select and first of all I want to see the class and then I want to see the maximum level within each class so if I run this you will see that I get exactly the same result that I have in Google Sheets so we have seen this before Max is an aggregation function it takes a list of Val vales and then compresses them down to a single value right except that before we were running it on at the level of the whole table right so if I select this query alone and run it what do you expect to see I expect to see a single value because it has looked at all the levels in the table and it has simply selected the biggest one it has reduced all of them to a single value however if I run it after defining a group buy then this will run not on the whole table at once it will run within each group identified by my grouping field and we’ll compute the maximum within that group and so the result of this will be that I can see the maximum level for each group now I’m going to delete this and I don’t need to limit myself to a single aggregation I can write as many aggregations as I wish so I will put this down here and I’ll actually give it a label so that it makes sense and then I will write a bunch of other aggregations such as count star which basically is the number of values within that class um I can also look at the minimum level I can also look at the average level so let’s run this and make sure that it works so as you can see we have our unique values for class as usual and then and for each class we can compute as many aggregated values as we want so we have the maximum level the minimum level and we didn’t give a label to this so we can call it average level and then number of values n values is not referring to level in itself it’s a more General aggregation which is simply counting how many examples I have of each class right so I know I have four Mages three archers four Hobbits and four Warriors by looking at this value over here and here’s another thing I am absolutely not limited to the level column as you can see I also have the experience column which is also an integer and the health column which is a floating Point number so I can get the maximum health and I can get the minimum [Music] experience and it all works all the same all the aggregations are computed within each class but one thing I need to be really careful of is the match between the type of aggregation that I want to run and the data type of the field on which I plan to run it so all of these that we show here they’re number columns right either integers or floats what would happen if I ran the average aggregation on the name column which is a string what do you expect to happen you can already see that this is an error why no matching signature for aggregate function average for a type string so it’s saying this function does not accept the type string it accepts integer float and all types of number columns but if you ask me to find the average between a bunch of strings I have no idea how to do that so I can add as many aggregations as I want within my grouping but the aggregations need to make sense but these Expressions can be as complex as I want them to be so instead of taking the average of the name which is a string it doesn’t make sense I could actually run another function instead of this inside of this which is length and what I expect this to do is that for each name it will count how long that name is and then after I’ve done all these counts I can aggregate them uh I could take the average for them and what I get back is the average name length within each class doesn’t sound really helpful as a thing to calculate but this is just to show you that these Expressions can get quite complex now whatever system you’re working with it will have a documentation in some place which lists all the aggregate functions that you have at your disposal so here is that page for big query and as you can see here we have our aggregate functions and if you go through the list you will see some of the ones that I’ve shown you such as count Max mean and some others that uh I haven’t shown you in this example such as sum so summing up all the values um any value which simply picks uh one value I think it it happens at random and U array a which actually built a list out of those values and so on so when you need to do an analysis you can start by asking yourself how do I want to subdivide the data what are the different groups that I want to find in the data and then after that you can ask yourself what type of aggregations do I need within each group what do I want to know um about each group and then you can go here and try to find the aggregate function that works best and once you think you found it you can go to the documentation for that function and you can read the description so Returns the average of non-null values in an aggregated group and then you can see what type of argument is supported for example average supports any numeric input type right so any data type that represents a number as well as interval which represents a space of time now in the previous example we have used a single grouping field right so if we go back here we have our grouping field which is class and we only use this one field to subdivide the data but you can actually use multiple grouping Fields so let’s see how that works what I have here is my items table and for each item we have an item type and a rarity type uh and then for each item we know the power so what would happen if we wanted to say to see the average Power by item type and Rarity combination one reason we might want to see this is that we might ask ourselves is within every item type is it always true that if you go from common to rare to Legendary the power increases is this true for all item types or only for certain item types let us go and find out so what what I’m going to do now is that I’m going to use two fields to subdivide my data I’m going to use item type and Rarity and to do this as a first step I will sort the data so that it makes it convenient for me so I will go here and I will say sort range Advanced ranged sorting option and first of all I want to sort by column A which is item type and I want to add another sort column which will be column B and you can see that my data has been sorted next I’m going to take each unique combination of the values of my two grouping Fields okay so the first combination is armor common so I’m going to take this here and then I’m going to to write down all the values that come within this combination so in this case we only have one value which is 40 next I have armor legendary and within this combination I only have one value which is 90 next I have armor rare So for armor rare I actually have two values so I’m going to write them here next we have potion and common for this we actually have three values so I’m going to write them here so I’ve gone ahead and I’ve done it for each combination and you can see that each unique combination of item type and Rarity I’ve now copied the re relevant values and now I need to get the average power with in these combinations so I will take the first one put it over here and then I will take the average of the values this is quite easy because there’s a single value so I’ll simply write 40 next I will take the armor legendary combination and once again I have a single value for armor rare I have two values so I will actually press equal and write average to call the the spreadsheet function and then select the two values in here to compute the average and here we have it and I can go on like this potion common get the average Within These values potion legendary is a single value so I’ve gone ahead and completed this and this gives me the result of my query here I have all the different combinations for the values of uh what were they item type and Rarity and within each combination the average power so to answer my question is it that within each item type the power grows with the level of Rarity where for armor it goes from 40 to 74 to 90 so yes for potion we don’t have um a rare potion but basically it also grows from common to Legendary and in weapon we have uh 74 87 and 98 so I would say yes within each item type power grows with the level of Rarity so what are these three fields in the context of my grouping well item type is grouping field and Rarity is also a grouping field and the average power within each group is a aggregate field right so I am now using two grouping fields to subdivide my data and then I’m Computing this aggregation within those groups so let us now figure figure out how to write this in SQL it’s actually quite similar to what we’ve seen before we have to take our data from the items table and then we want to group by and here I have to list my grouping Fields okay so as I’ve said I have two grouping Fields they are item type and and Rarity so this defines my groups and then in the select part I will want to see my grouping fields and then within each group I will want to see the average of power I believe we used yes so I will get the average of power and here are our results just like in the sheets now as a tiny detail you may notice that power here is colored in blue and the reason for this is that power is actually a big query function so if you do power of two three you should get uh eight because it calculates the two to to to the power of three so it can be confusing when power is the name of a column because B query might think it’s a function but there’s an easy way to remedy this you can just use back ticks and that’s your way of telling big query hey don’t get confused this is not the name of a function this is actually the name of a column and as you can see it also works and it doesn’t create issues and just like before we could add as many aggregations as we wanted and for example we could take the sum of power also on other fields not just on Power and everything would be computed within the groups defined by the two grouping fields that I have chosen as expected now now let us see where Group by fits in The Logical order of SQL operations so as you know a SQL query starts with from and join this is where we Source the data this is where we take the data that we need and as we learned in the join section we could either just specify a single table in the from clause or we could specify a join of two or more tables either way the result is the same we have assembled the table where our data leaves and we’re going to run our Pipeline on that data we’re going to run all the next operations on that data next the work Clause comes into play which we can use in order to filter out rows that we don’t need and then finally our group group Pi executes so the group Pi is going to work on the data that we have sourced minus the rows that we have excluded and then the group Pi is going to fundamentally alter the structure of our table because as you have seen in our examples the group I basically compresses down our values or squishes them as I wrote here because in the grouping field you will get a single Row for each distinct value and then in the aggregate field you will get an aggregate value within each class okay so if I use a group bu it’s going to alter the structure of my table after doing the group bu I can compute my aggregations like you’ve seen in our examples so I can compute uh minimum maximum average sum count and and all of that and of course I need to do this after I have applied my grouping and after that after I I’ve computed my aggregations I can select them right so I can choose which columns to see um and this will include the grouping fields and the aggregated fields we shall see this more in detail in a second and then finally there’s all the other oper ations that we have seen in this course and this is where Group by and aggregations fit in our order of SQL operations now I want to show you an error that’s extremely common when starting to work with group pi and if you understand this error I promise you you will avoid a lot of headaches when solving SQL problems so I have my IDE items table here again and you can see the preview on the right and I have a simple SQL query okay so take the items table Group by item type and then show me the item type and the average level of power within that item type so so far so good but what if I wanted to see what I’m showing you here in the comments what if I wanted to see each specific item the name of that item the type of that item and then the average Power by the type of that item right so let’s look at the first item chain mail armor this is a armor type of item and we know that the average power for armors is 69.5 so I would like to see this row and then let’s take Elven bow now Elven baow is a weapon as you can see here the average powerful weapons is 85. 58 and so I would like to see that now stop for a second and think how might I achieve this how might I modify my SQL query to achieve this oh and there is a error in the column name over here because I actually wanted to say name but let’s see how to do it in the SQL query so you might be tempted to Simply go to your query and add the name field in order to reproduce What you see here and if I do this and I run it you will see that I get an error select expression references column name which is neither grouped nor aggregated understanding this error is what I want to achieve now because it’s very important so can you try to figure out on your own why this query is failing and what exactly this error message means so I’m going to go back to my spreadsheet and get a copy of my items table and as you can see I have copied the query that doesn’t work over here so let us now uh go ahead and reproduce this query so I have to take the items table here it is and then I have to group by item type and as you can see I’ve already sorted by item type to facilitate our work and then for each item we want to select the item type so that would be armor and we want to select the average power so to find that I can run a spreadsheet function like this it’s called average and get the power over here and then I am asked to get the name so if I take the name for armor and put it here this is what I have to add and here you can already see the problem that we are facing for this particular class armor there is a mismatch in the number of rows that each column is providing because as an effect of group by item type now there is only one row in which item type is armor and as an effect of applying average to power within the armor group now there is only one row of power corresponding to the armor group but then when it comes to name it’s neither present in a group Pi nor is it present in an aggregate function and that means that in the case of name we still have four values four values instead of one and this mismatch is an issue SQL cannot accept it because SQL doesn’t know how to combine columns which have different numbers of rows in a way it’s like SQL is telling us look you’ve told me to group the data by item type and I did so I found all the rows that correspond to armor and then you told me to take the average of the power level for those rows and I did but then you asked me for name now the item type armor has four names in it what am I supposed to do with them how am I supposed to combine them how am I supposed to squish them into a single value you haven’t explained how to do that so I cannot do it and this takes us to a fundamental rule of SQL something I like to call the law of grouping and the law of grouping is actually quite simple but essential it tells you what type of columns you can select after you’ve run a group pi and there are basically two types of columns that you can select after running a group bu one is grouping Fields so those those are the columns that appear after the group by Clause those are the columns you are using to group the data and two aggregations of other fields okay so those are fields that go inside a Max function a mean function a sum function a count function and so on now those are the only two types of columns that you can select if you try to select any other column you will get an error and the reason you will get an error is Illustrated here after a group Pi each value in the grouping Fields is repeated exactly once and then for that value the aggregation makes sure that there’s only one corresponding value in the aggregated field in this case there’s only one average power number within each item type however any other field if it’s not a grouping field and you haven’t run an aggregation on it you’re going to get all of its values and then there’s going to be a mismatch so the law of grouping is made to prevent this issue now if we go back to our SQL hopefully you understand now better why this error Isen happening and in fact this error message makes a lot more sense after you’ve heard about the law of grouping you are referencing a column name which is neither grouped nor aggregated so how could we change this code so that we can include the column name without triggering an error well we have two options either we turn it into a grouping field or we turn it into an aggregation so let’s try turning it into an aggregation let’s say for example that I said mean of name what do you expect would happen in that case so if I run this you will see that I have my grouping by item type I have the average power within each item type and then I have one name and so when you run mean on a sequence of uh text values what it does is that it gives you the first value in alphabetical order so we are in fact seeing the first name in alphabetical order within each item type so we’ve overcome the error but this field is actually not very useful we don’t really care to see what’s the first name in alphabetical order within each type but at least our aggregation is making sure that there’s only one value of name for each item type and so the golden rule of grouping is respected and we don’t get that error anymore the second alternative is to take name and add it as a grouping field which simply means putting it after item type type in here now what do you expect to happen if I run this query so these results as they show here are a bit misleading because there’s actually the name column is hidden so I will also add it here and as you can see I can now refer the name column in select without an aggregation why because it is a grouping field okay and what do we see here in the results well we’ve seen what happens when you Group by multiple columns that the unique combinations of these columns end up subdividing the data so in fact our values for average power are not divided by item type anymore we don’t have the average power for armor potion and weapon anymore we have the average power for an item that’s type armor and it’s called chain mail armor and that is in fact there’s only one row that does that and has power 70 likewise we have the average power for uh any item called cloak of invisibility which is of item type armor and again there’s only one example of that so we’ve overcome our error by adding name as a grouping field but we have lost the original group division by item type and we have subdivided the data to the point that it doesn’t make sense anymore so as you surely have noticed by now we made the error Disappear by including name but we haven’t actually achieved our original objective which was to show the name of each item the item type and then the average power within that item type well to be honest my original objective was to teach you to spot this error and understand the law of grouping but now you might rightfully ask how do I actually achieve this and the answer unfortunately is that you cannot achieve this with group Pi not in a direct simple way and this is a limitation of group Pi which is a very powerful feature but it doesn’t satisfy all the requirements of aggregating data the good news however is that this can be easily achieved with another feature called window functions now window functions are the object of another section of this course so I’m not going to go into depth now but I will write the window function for you just to demonstrate that it can be done easily with that feature so I’m going to go down here and write a a new query I’m going to take the items table and I’m going to select the name and the item type and then I’m going to get the average of power and again I’m going to use back ticks so bigquery doesn’t get confused with the function that has the same name and then I’m going to say take the average of power over Partition by item type so this is like saying average of power based on this item type and I will call this average Power by type and if I select this and run the query you will see that I get what I need I have a chain mail armor it’s armor and the average power for an armor is 69.5 so this is how we can achieve the original objective unfortunately not with grouping but with window functions now I want to show you how you can filter on aggregated values after a group buy so what I have here is a basic Group by query go to the fantasy characters table group it by class and then show me the class and within each class the average of the experience for all the characters in that class and you can see the results here now what if I wanted to only keep those classes where the average experience is at least 7,000 how could I go and do that one Instinct you might have is to add a wear filter right for example Le I could say where average experience is greater than or equal to 7,000 and if I run this I get an error unrecognized name average experience the wear filter doesn’t work here maybe it’s a labeling problem what if I actually add the logic instead of the label so what if I say where average of experience is bigger or equal to 7,000 well an aggregate function is actually not allowed in the work Clause so this also doesn’t work what’s happening here now if we look at the order of SQL operations we can see that the where Clause runs right after sourcing the data and according to our rules over here an operation can only use data produced before it and doesn’t know about data produced after it so the wear operation cannot have any way of knowing about aggregations which are computed later after it runs and after running the group bu and this is why it is not allowed to use aggregations inside the wear filter luckily SQL provides us with a having operation which works just like the wear filter except it works on aggregations and it works on aggregations because it happens after the group buy and after the aggregations so to summarize you can Source the table and then drop rows before grouping this is what the wear filter is for and then you can do your grouping and Compu your aggregations and after that you have another chance to drop rows based on a filter that runs on your aggregations so let us see how that works in practice now instead of saying where average experience actually let me just show you what we had before this is our actual result and we want to keep only those rows where average experience is at least 7,000 so after group Pi I will write having and then I will say average experience greater than or equal to 7,000 let me remove this part here run the query and you can see that we get what we need and you might be thinking well why do I have to to write down the function again can’t I just use the label that I’ve assigned well let’s try it and see if it still works and the answer is that yes this works in Big query however you should be aware that bigquery is an especially userfriendly and funto use product in many databases however this is actually not allowed in the sense that the database will not be kind enough to recognize your label in the having operation instead you will have to actually repeat the logic as I’m doing now and this is why I write it like this because I want you to be aware of this limitation another thing that you might not realize immediately is that you you can also filter by aggregated columns which you are not selecting so let’s say that I wanted to group by class and get the average experience for each class but only keep classes with a high enough average level I am perfectly able to do that I just have to write having average level greater than or equal to 20 and after I run this you will see that instead of four values I actually get three values so I’ve lost one value and average level is not shown in the results but I can of course show it and you will realize that out of the values that have stayed they all respect this condition they all have at least 20 of average level so in having you are free to write filters on aggregated values regardless of the columns that you are selecting so to summarize once more you get the data that you need you drop rows that are not needed you can then Group by if you want subdivide the data and then compute aggregations within those groups if you’ve done that you have the option to now filter on the result of those aggregations and then finally you can pick which columns you want to see and then apply all the other operations that we have seen in the course we are now ready to learn about window function a very powerful tool in SQL now window functions allow us to do computations and aggregations on multiple rows in that sense they are similar to what we have seen with aggregations and group bu the fundamental difference between grouping and window function is that grouping is fundamentally altering the structure of the table right because if I go here and I take this items table and I group by item type right now I’m looking at uh about 20 rows right but if I were to group the resulting table would have one two three three rows only because there’re only three types of items so that would significantly compress the structure of my table and in fact we have seen with the basic law of grouping that after you apply a group ey you have to work around this fundamental alteration in the structure of a table right because here you can see that the items table has 20 rows but how many rows do you expect it to have after you Group by item type I would expect it to have three rows because there’s only three types of items and so my table is being compressed my table is changing its structure and the basic law of grouping teaches you how to work with that it tells you that if you want a group by item type you can just select power as is because your table will have three rows but you have 20 values of power so you have to instead select an aggregation on power so that you can compress those values to a single value for each item type and if you want to select name you also cannot select name as is you also have to apply some sort of aggregation for example you could put the names into a list an array uh or so on but window functions are different window functions allow us to do aggregations allow us to work on multiple values without however altering the structure of the table without changing the number of rows of the table so let us see how this works in practice now imagine that I wanted to get the sum of all the power values for my items so what is the total power for all of my items so you should already be aware of how to do this in SQL to just get that sum right I can I can do this by getting my fantasy items table and then selecting the sum over the power so if I take this query and paste it in big query I will get exactly that and this now is a typical aggregation right the sum aggregation has taken 20 different values of power and has compressed them down to one value and it has done the same to my table it’s taken 20 different rows to my table and it has squished them it has compressed them down to one row and this is how aggregations work as we’ve seen in the course but what if I wanted to show the total power without altering the structure of the table what if I wanted to show the total power on every Row in other words I can take the sum of all the values of power and this is the same number that we’ve seen in B query and I can paste it over here and hopefully I can now expand it and this is exactly what I meant what if I can take that number and put it on every row and why would I want to do this well there’s several things that I can do with this setup right for example I could go here um for Phoenix Feather which is power 100 and I could say take this 100 and divide it by the total power in this row and then turn this into a percentage and now I have this 6.5 approximately percentage and thanks to this I can say Hey look um the phoenix feather covers about 6 or 7% of all the power that is in my items of all the power that is in my game and that might be a useful information a more mundane concern uh could be that this is uh your your budget so this is the stuff you’re spending on and instead of power you have the the price of everything and then you get the total sum right which is maybe what you spent in a month and then you want to know going at the movies what percent of your budget it covered and so on now I will delete this value because we’re not going to use it and let us see what we need to write to obtain this result in SQL so once again we go to the fantasy items table and I’m going to move it a bit down and then we select the sum power just just like before except that now I’m going to add this over open round bracket and close round bracket and this is enough to obtain this result well to be precise when I write this in B query I will want to see a few columns as well so I will want to see the name item tab Ty and power and here I will need a comma at the end as well as the sum power over and I will also want to give a label to this just like I have in the spreadsheet now this is the query that will reproduce What you see here in the spreadsheet so how this works is that the over keyword is signaling to SQL that you want to use a window function and this means that you will get an aggregation you will do a calculation but you’re not going to alter the structure of the table you are simply going to take the value and put it in each row this is what the over keyword signals to SQL now because this is a window function we also need to define a window what exactly is a window a window is the part of the table that each row is is able to see now we will understand what this means much more in detail by the end of this lecture so don’t worry about it but for now I want to show you that this is the place where we usually specify the window inside these brackets after the over but we have nothing here and what this means is that our window for each row is the entire table so that’s pretty simple right each row sees the entire table so to understand how the window function is working we always have to think row by row because the results can always be different on different rows so let us go row by row and figure out how this window function is working so now we have the first row and what is the window in this case meaning what part of the table does does this row see well the answer is that this row sees all of the table given that it sees all of the table it has to do the sum of power and so it will take this thing compute a sum over it put it in the cell now that was the first row moving on to the second row now what’s the window here what part of the table does this row see once again it sees all of the table given that it sees all of the table it takes power computes some over it gets the result and puts it in the cell now I hope you can see that the result has to be identical in every cell in every Row in other words because every row sees the same thing and every Row computes the same thing and this is why every Row in here gets the same value and this is probably the simplest possible use of a window function so let us now take this code and bring it to B query and make sure that it runs as intended and like I said in the lecture on grouping you will see that power is blue because bequer is getting confused with its functions so always be best practice to put it into back tis to be very explicit that you are referring to a column but basically what you see here is exactly what we have in our sheet and now of course we have this new field which shows me the total of power on every row and like I said we can use this for several purposes for example I can decide to show for each item what p percentage of total power it covers right that’s what I did before in the sheet so to do this I can take the power and I can divide by this window expression which will give me the total power not sure what happened there but let me copy paste here and I can call this percent total power now this is actually just a division so if I want to see the percentage I will have to also multiply by 100 but we know how to do this and once I look at this we can see that when we have power 100 we have almost 6.5% of the total power so this is the same thing that we did before and this goes to show that you can use these fields for your calculations and like I said if this was your budget you could use this to calculate what percentage of your total budget is covered by each item it’s a pretty handy thing to know now why do I have to take this uh to repeat uh all of this logic over here why can’t I just say give me power divided by some power well as you know from other parts of the course the select part is not aware of these aliases it’s not aware of these labels that we are providing so when I try to do this it won’t recognize the label so unfortunately if I want to show both I have to repeat the logic and of course I’m not limited to just taking the sum right what I have here is an aggregation function just like the ones we’ve seen with simple aggregations and grouping in aggregation so instead of sum I could use something like average using the back TI over right I need to remember uh to add the over otherwise it won’t work because it won’t know it’s a window function and I can give it a label and now for each row I will see the same value which is the average of power over the whole data set and you you can basically use any aggregation function that you need it will work all the same few more btics to put in here just to be precise but the result is what we expect now let us proceed with our Explorations so I would like now to see the total power for each row but now I’m not interested in the total power of the data set I’m interested of in the total Power by item type okay so if my item is an armor I want to see the total power of all armors if my have item is a potion I want to see the total power of all potions and so on because I want to compare items within their category I don’t want to compare every item with every item so how can I achieve this in the spreadsheet well let us start with the first r row so I need to check what item type I have and conveniently I have sorted this so we can be quicker now we have an armor so I want to see the total power for armor so what I can do is to get the sum function and be careful to select only rows where the item type is armor and this is what I get and then the next step would be to Simply copy this value and then fill in all of the rows which are armor because for all of the rows but again you have to be careful because the spreadsheet wants to complete the pattern but what I want is the exact same number and then all of the rows that have item type armor will have this value because I’m looking within the item type now I will do it for potion so here I need to get the sum of power for all items that are potions 239 and then make sure to co copy the exact same value and to extend it to all potions and next we have weapons so sum of all power by weapon which is here then copy it and copy it and then let’s see if it tries to complete the pattern it does so I’m just going to go ahead and paste it and now make this a bit nicer and now I have what I wanted to get each row is showing the total power within the items that are the same as the one that we see in the row now how can I write this in SQL so let me go ahead and write it here now two parts of this query will be the same same because we want to get the items table and see these columns but we need to change how we write the window function so once again I want to get the sum of power and I will need now to define a specific window now remember the window defines what each row sees so what do I want each row to see when it takes the sum of power for example what do I want the first row to see when it takes the sum of power I wanted to see only rows which have the item type armor or in other words all the rows with the same item type and I can achieve this in the window function by writing Partition by item type by adding a partition defining the window as a partition by item type means that each row will look at its item type and then we’ll partition the table so that it only sees rows which have the same item type so this row over here will see only these four rows and then you will take the sum of power and then you will put it in the cell and for this uh the second third third and fourth row the result will be the same because they will each see this part of the table when we come to potion so this row over here will say hey what is my item type it’s potion okay then I I will only look at rows that have item type potion and so this will be the window for these four rows and then in those rows I’m going to take power and I’m going to Summit and finally when we come to to these rows over here so starting with this row it will look at its item type and say okay I have item type uh weapon let me look at all the rows that share the same item type and so each window will look like this so let me color it properly its window will look like this and then it will take the sum of these values of power that fit in the window and put it in the cell second cell sees the same window sums over these values of power puts it in the cell and this is how we get the required result this is how we use partitioning in window functions so let’s go now to Big query and make sure that this actually works and when I run this I didn’t put a label but you can see that I’m basically getting the same result when I have a weapon I see a certain value when I have a potion I see uh another one and when I have an armor I see the third value so now for each item I am seeing the total power not over the whole table but within the item type now next task find the cumulative sum of power which is this column over here what is a cumulative sum it’s the sum of the powers of this item plus all of the items that are less powerful so to do this in the spreadsheet I will first want to reorder my data because I want to see it simply in order of power so I will actually take this whole range and I will go to data sort range Advance options and I will say that the data has a header row so that I can see the names of the columns and then I will order by power ascending so as you can see my records have now been sorted in direction of ascending power now how do I compute the cumulative sum of power in the first row all we have is 30 so the sum will be 30 in the second row I have 40 in this row plus 30 before so E I will have 70 when it comes here I have 50 in this row and then the sum up to now was actually 70 which I can see by looking at these two cells or I can see more simply by looking at the last cell so 50 + 70 will be 820 and proceeding like this I could compute the cumulative power over the whole column now for your reference I have figured out the correct Google Sheets formula that will allow you to compute the cumulative sum of power for our example and I went ahead and computed it so that we have it for all our data now this is is the formula right here and I’m not going to go in depth into it because this is not a course on on spreadsheets but I will show you the formula just in case you’re curious so the sum IF function will take the sum over a range only but it will only consider values that satisfy a certain logical condition so the first argument is the range that we want to sum over and this is the power and the Criterion so what needs to be true for a value to be um to be considered is that this value is lesser than or equal to the level of power in this row so what this formula is saying is take the level of power in this row and then take all the values of power which are lesser or equal and then sum them up this is exactly what our window function does and so our formula reproduces this now if you go and look what’s the way to do a cumulative sum in Google Sheets or what’s the way to do a running total there are other Solutions but they do come with some um pitfalls they do come with some Corner cases so this is a Formula that’s actually reproducing the behavior of SQL now let us go back to actually SQL and see how we would write this so I’m going to take the fantasy items table and I’m still going to select the columns and now I have to write my window function now the aggregation is just the same so take the sum of power and now I have to Define my window now my window is not defined Now by a partition but it is defined by an ordering order by power and when I say order by power in a window function what’s implicit in this is the keyword ask for ascending so this means that the window will order power from the smallest to the biggest and I can choose to write this keyword or not because just like in order by in SQL when you don’t specify it the default value is ascending from smallest to biggest so how does this window work work let’s start with the first row and let’s say we need to fill in this value so I’m going to look at my power level it is 30 and then the window says that I can only see rows where the power level is equal or smaller and what are the rows where the power level is equal or smaller to 30 there’re these rows over here so effectively this this is the only part of the table that this window sees on the first row and then take the sum over power so sum over 30 is 30 move on to the second row the power level is 40 the window says I only see rows where the power level is smaller uh or equal and this includes these two rows over here now take the sum of power over here you get 70 put it in the cell third row I have power level 50 I’m only seeing these rows so take the sum of power over this it’s 120 put it in the cell and I can continue like this until I get to the highest value in my data set it’s 100 never mind that is not the last row because both of the last two rows they have the highest value and when you look at this um when you come to this row and you look at 100 and and you say what’s the window what rows can I see I can see all rows where power is 100 or less and that basically includes all of the table right it includes all of the table so when you take the sum of power you will get the total sum and in fact you can see that in this case the cumulative power is equal to the total power that we computed before just as we would expect so this is easy to see here because we have ordered um our data conveniently but it works in any case and so what the order by does in a window function is that it makes sure that each row only sees rows which come before it given your ordering so if I want to order from the smallest power to the biggest power each row will only see rows that come before it in this ordering so they have the same level of power or lower but they don’t have a higher level of power so let us now take it to Big query and make sure it works as intended and I will add an ordering by power and here I will see the same thing that I’ve shown you in the spreadsheet I notice now that some numbers are different that these two items have 90 instead of 100 but never mind that the logic is the same and the numbers make sense now I’m also able to change the direction of the ordering right so let’s say that I take this field and copy it just the same except that instead of ordering by power ascending I order by power descending so what do you expect to see in this case let’s take a look now what I see here is that each item is going to look at its level of power and then it’s only going to consider items that are just as powerful or more powerful right so it’s the exact same logic but it’s reversed so when you look at the weakest item potion it has 30 and so it is looking at all the items because there’s no weaker item and so it finds the total level of power in our data set but if you go to the strongest item like Excalibur it has a power level of 100 and there’s only two items in the whole data set that have this power level itself and the phoenix feather so if you sum the power over this you get 200 so you can see it’s the exact same logic but now each row only sees items that have the same level of power or higher so when you order inside a window function you can decide the direction of this ordering by using descending or ascending or if you are a lazy programmer you can omit the um ascending key word and it will work just the same because that’s the default and finally we want to compute the cumulative sum of Power by type and you might notice that it is in a way the combination of these two uh requirements so let us see how to do that now the first thing I want to do is to sort our data in order to help us so I’m going to get this whole thing and I’m going to say sort range I’m going to need the advanced options I have a heading row and so first of all I want to order by type and then within each type I want to order by power and this is our data now now for each item I want to show the cumulative sum of power just like I did here except that now I only want to do it within the same item type so if we look at Armor it’s already sorted right so I have power 40 and this is the smallest one so I will just put 40 over here next I have uh this item with power 70 it’s still armor has power 70 and so I’m going to look at these two values and sum them up now I have uh 7 8 so I will take this plus 78 which is the sum of these three values and finally I have um 90 which is the sum of those values and now I’m done with armor right I’m beginning with a new item type so I have to start all over again I’m looking at potions now so we start with 30 that is the smallest value then we move to uh 50 so this is now seeing 30 and 50 uh which is 80 add 60 to 80 that is 140 and finally we want to add we want to add 99 plus 140 which is another way of saying that we want to add these values all the values for potion so this is what we want cumulative sum of power within item type so we do it within the item type and then when we find a new type we start over so to calculate it for weapon I could copy my function from here paste it in weapon and then I would need to modify it right I would need the range to only include weapon so that’s from C10 so go here C10 is the first one and the value that I want to look at here would have to be C10 as well because I want to start by looking at the power level for the for weapon and for some reason it’s purple however it should be correct it should always be the sum of the previous value so we start with 65 then we have 65 + 75 66 75 65 and so on so this is our result it’s cumulative power within the item type and to write this in SQL I will take my previous query over here and now when we Define the window we can simply combine what we’ve done before we can combine the partition buy with the order bu and you need to write them in the following order first the partition and then the order so I will Partition by item type and I will order by power ascending and this will achieve the required result so for each row in this field the window will be defined as follows first Partition by item type right so first of all you can only see rows which have the same item type as you have but then within this partition you can you have to keep only rows where the power is equal or smaller than what you have so in the case of the first item you only get this row likewise in the case of the first potion item you only get this row if you look at the second armor item again it looks it partitions right so it looks at all the items which have armor but then it has to discard those that have a bigger power than itself so it will be looking at these two rows and if for example example we look at the last row over here so this row will say oh okay I’m a weapon so I can only see those that are weapon and then I can only see those that have a level of power that’s equal or smaller than mine and that checks out those are all the rows and in fact the sum over here is equal to the sum of Power by type which is what we would expect so once again let us verify that this works in Big query and I will actually want to order by item type and power just so I have the same ordering as in my sheet and I should be able to see that within armor you have this like growing uh cumulative sum and then once the item changes it starts all over right it starts again at the value it grows it grows it accumulates and then we’re done with potions and then we have weapons and then again it starts and then it grows and it goes all the way to include the total sum of all powers in the weapon item type so here’s a summary of all the variants of Windows that we’ve seen we have seen four variants now in all of those for clarity we’ve kept the aggregation identical right we are doing some over the power field but of course you know that you can use any aggregate function here on any column which is compatible with that aggregate function and then we have defined four different Windows the first one is the simplest one there’s actually nothing in the definition we just say over and this means that it will just look at all the table so every row will see the whole table and so every row will show you the total of power for the whole table simple as that the second window is introducing a partition by item type and what this means in practice is that each row will uh look at its own item type and then only consider rows which share the same exact item type and So within those rows it will calculate the sum of power third window we have an ordering field so what this means is that each row is going to look at its level of power because we are ordering by power and then it’s going to only see rows where the power level is equal or smaller and the reason why we’re looking in this direction is that when we order by power is implicitly uh understood that we want to order by power ascending If instead we ordered by power descending it would be the same just in the opposite direction each row would would look at its level of power and then only consider rows where power is equal or bigger and then finally we have a combination of these two right a we have a window where we use both a partition and an order and so what this means is that uh each row is going to look at its item type and discard all of the rows which don’t have the same item type but then within the rows that remain it’s going to apply that ordering it’s going to only consider rows which have the same level of power or lesser so it’s simply a combination of these two conditions and this is the gist of how window functions work first thing to remember window function provide aggregation but they don’t change the structure of the table they just insert a specific value at each row but after applying a window function the number of rows in your table is the same second thing thing to remember is that in the window definition you get to Define what each row is able to see when Computing the aggregation so when you are thinking about window function you should be asking yourself what part of the table does each row see what’s the perspective that each row has and there are two dimensions on which you can work in order to Define these windows one is the partition Dimension and the other is the ordering Dimension the partition Dimension Cuts up the table based on the value of a column so you will only keep rows that have the same value the order Dimension Cuts up the table based on the ordering of a field and then depending on ascending or descending depending on the direction that you choose you can you can look at rows that are after you in the ordering or you can look at rows that are before you in the ordering and you can pick either of these right either partitioning or ordering or you can combine them and by using this you can Define all of the windows that you might need to get your data now as a quick extension of this I want to show you that you’re not limited to defining windows on single fields on single columns you can list as many columns as you want so in this example I’m going to the fantasy characters table I’m getting a few columns and then I’m defining an aggregation uh on a window function so I’m taking the level uh field and I’m summing it up and then I’m partitioning by two Fields actually by Guild and is alive so what do you expect to happen if I do this this is actually the exact same logic as grouping by multiple fields which we’ve seen in the group ey now the data is not going to be divided by Guild and is not going to be divided by whether the character is alive or not but by the all the mutual combinations between these fields okay so um merkwood and true is one combin ation and so the people in here are going to fit together right so in fact we have two characters here 22 and 26 and their sum is 48 so you can see here that they both get 48 for sum of level and likewise when you look at Sher folk true these three they all end up in the same group and so they all share the same sum of level which is 35 but sh Fulk fals this is another group and they’re actually alone right it’s 12 and then the sum is 12 so again when you Partition by multiple Fields the data is divided in groups that are obtained by all the combinations between the values that these fields can have and if you experiment a bit by yourself you should have an easier time to convince yourself of this likewise the same idea applies to the order uh part of a window we have until now for Simplicity ordered by one field to be honest most times you will only need to order by one field but sometimes you might want to order by different fields so in this example you can see that we are defining our ordering based on two Fields power and then weight and then based on that ordering we calculate the sum of power and this is again a case of cumulative sum however now the ordering is different and you will realize this if we go to the most powerful items in our data these last two which are both at 100 so if you remember when we were ordering by power alone these two uh Fields had the same value in this um window function because when you order just by power they are actually the same they both have 100 but because now we’re ordering by weight and again we’re ordering by weight ascending so from the smallest weight to the biggest weight now the phoenix feather comes first because although it has the same power as Excalibur the Phoenix weather is lighter and because it comes first it has a different value for this aggregation and of course we have the power to to say ascending or descending on each of the fields by which we order so if I wanted to reverse this I could simply write descending after the weight and be careful that in this case descending is only referring to weight it’s not referring to power so this is just as if I’ve wrote this right so the this one can be omitted um because it’s ascending by default but I would write both to be clear and now if I run this you will see that our result is reversed right Excalibur comes first because we have weight descending so it’s heavier and then last we have the phoenix feather which is lighter and again understanding this theoretically is one thing but I do encourage you to experiment with this with your data with exercises and then you will um you will be able to internalize it and now we are back to our schema for The Logical order of SQL operations and it is finally complete again because we’ve seen all of the components that we can use to assemble our SQL query and now the question is where do window functions fit into this well as you can see uh we have placed them right here so what happens is that again you get your data and then the we filter runs dropping rows which you don’t need and then you have a choice whether to do a group by right now if you do a group by you’re going to change the structure of your table it’s not going to have the same number of rows it’s going to have a number of rows that depends of the unique values of your grouping field or the unique combinations of values of your Fields if you have used more than one if you group you will probably want to compute some aggregations and then you may want to filter on those aggregations meaning dropping rows uh based on the values of those aggregations and here is where window functions come into play it is on this result that window functions work so if you haven’t done a group bu then window functions will work on your data after the wear filter runs if you have done a group buy we window functions will work on the result of your aggregation and then after applying the window function you can select which columns you want to show give them uh labels and then all the other parts run right so you can choose to drop duplicates from your result meaning duplicate rows rows which have the same value on every column you can stack together different tables right you can put them on top of each other and then finally when you have your result you can apply some ordering and also you can cut the result you can limit it so you only show a few uh rows and this is where window functions fit into the big scheme of things and there are some other implications of this ordering one interesting one is that if you have computed aggregations such as the sum of a value Within within a um a class um you can actually use those aggregations in the window function so you can sort of do an aggregation of an aggregation but this is uh in my opinion an advanced topic and it doesn’t fit into this um fundamentals course it may fit uh someday in a later more advanced course I want to show you another type of window functions which are very commonly used and very useful in SQL challenges and SQL interviews and these are numbering functions numbering functions are functions that we use in order to number the rows in our data according to our needs and there are several numbering functions but the three most important ones are without any doubt row number dense Rank and rank so let’s let’s see how they work in practice now what I have here is a part of my uh inventory table I’m basically showing you the item ID and the value of each number and conveniently I have ordered our rows uh by value ascending okay and now we are going to number our rows according to the value by using these window functions now I’ve already written the query that I want to reproduce so I’m going to the fantasy inventory table and then I’m selecting the item ID and the item value as you see here and then I’m using uh three window functions so the syntax is the same as what we’ve seen uh in the previous exercise except that now I’m not using an aggregation function over a field like I did before when I was doing a sum of power and so on but I’m using another type of function this is a numbering function okay so this functions over here they don’t actually take a parameter as you can see that there’s nothing between these round brackets because I don’t need to provide it an argument or a parameter all I need to do is to call the function but what really uh what’s really important here is to define the correct window and as you can see in the three examples here the windows are all the same I am simply ordering my rows by value ascending which means that when it’s going to compute the window function every row will look at its own value and then say okay I’m only going to see rows where the value is the same or smaller I’m not going to be able to visualize rows where the value is bigger than mine and this is what the window does so the first row over here will’ll only see value of 30 the second row will see this the third row will see these and so on up until the last row which will see itself and all the other rows as well now let us start with row number so row number is going to use this ordering over here in order to number my rows and it’s as simple as saying putting one in the first row two in the second one 3 four and so on so if I extend this pattern I’m going to get a number for every row and that’s it that’s all that row number does it assigns a unique integer number to every row based on the ordering that’s defined by the window function and you might think oh big deal why do I need this don’t I already have like row numbers over here in the spreadsheet well in Pro SQ problems you often need to order things based on different values and um row number allows you to do this you can also have many different orderings coexisting in the same table based on different conditions and that can come in handy as you will discover if you do SQL problems now let’s move on to ranking so first of all we have dense rank okay and ranking is another way of counting but is slightly different sometimes you just want to count things you know sometimes uh like we did here in row number like I don’t know you are a dog sitter and you’re given 20 dogs and you getting confused between all their their names and then you assign a unique number to every dog so that you can identify them uh and you can sort them by I don’t know by age or by how much you’re getting paid to docit them sometimes on the other hand you want to rank things like when choosing which product to buy or expressing the results of a race right if and the difference between ranking and Counting can be seen when you have the same value right so when you want to Simply number like we did here when you want to Simply assign assign a different number to each element and two things have the same value then you don’t really care right you need to sort of arbitrarily decide that okay one of them will be a number two and one of them will be number three but you cannot do the same for ranking if two students in a classroom get the best score you can’t just randomly choose that one of them is number one and the other is number two they have to both be number one right and if two people finish a race at at the same time and is the best time you can’t say that one uh won the race and the other didn’t that because one is number one the other is arbitrarily number two they both have to be number one right they have to share that Rank and this is where ranking differs so let’s go in here and apply our rank now we are ordering by value ascending which means that the smallest value will have rank number one and so 30 has rank number one now we go to the second row and again remember window functions that you always have to think row by row you have to think what each row sees and what each row decides so again the row is going to order by uh value so it’s only going to see these values over here and it has to decide its rank so this row says uh oh I’m not actually number one because there is a value which is smaller than me so that means I have to be number number two and then we get to the third row and this row is uh seeing all the values that come before it right they’re equal or or or smaller and now it’s saying oh I’m not number one because there’s something smaller but then uh the value 50 which uh this guy has uh is rank two and I have the same value number 50 we arrived in the same spot so I must have the same rank okay and this is the difference between row number and rank that identical values get the same rank but they don’t get the same row number and now we come to this row which is 60 so it’s going to look back and it’s going to say oh from what I see 30 is the smallest one so it has a rank of one and then you have 50 and 50 they both share a rank of two but I am bigger so I need a new rank and so what am I going to pick now as a new rank well I’m going to pick three because it’s the next uh number in the sequence then the next one is going to pick four the next one is going to pick five and then we have six and then it proceeds in the following way so I’ll do it quickly now so 7 8 9 10 11 and again careful here we’re sharing the same value so they are both 11 next we can proceed to 12 13 again the same value right so they have to share the 13th spot 14 so 14 for 1700 and then 14 again and then 15 and then 16 and this is what we expect to see when we compute the dense rank and finally we come to rank now rank is very similar to dense rank but there is one important difference so let’s do this again smallest value has rank number one like before and then we have 50 which has rank number two and then 50 is once more sharing rank number two and now we move from 50 to 60 so we need a new rank but instead of three we put four over here why do we put four because the previous rank covered uh two rows and it sort of at the three it sort of expanded to eight the three So based on the rules of Simply rank we have to lose the three and put four over here so this is just another way of managing ranking and you will notice that it conveys another piece of information compared to dense rank because not only I see that um this row over here has a different rank than the previous row but I can only I can also see how many members were covered by the previous uh ranks I can see that in the previous ranks uh they must have involved three members because I’m at four already and this piece of information was not available for dence rank so I will continue over here and so I have a new value which is uh rank five and then I have rank six rank seven rank 8 rank n Rank 10 rank 11 now I have rank 12 and again I have to share the rank 12 because two identical values but now because 12 has eaten up two spots I can’t use the 13 anymore the second 12 has like eaten the 13 and so I need to jump straight to 14 15 15 again and now I have to jump to 17 because 15 had two spots 17 again and now I have to jump to 19 and then finally I have 20 so you can see that the final number uh is 20 for rank just as with row number because it’s not only differentiating between ranks but it’s also counting for me how many elements have come before me how many rows are contained in the previous ranks I can tell that there’s 19 rows in the previous ranks uh because of how rank Works whereas with 10 rank we end ended up using only 16 uh ended up being only up to 16 so we sort of lost information on how many records we have and this might be one of the reasons why by default you have this method of ranking instead of this method of ranking even though dense rank seems more intuitive when you are uh building the ranking yourself so we can now take this query and hopefully I’ve written it correctly and go to big query and try to run it and as you can see we have our items they are sorted by value and then we have our numbering functions so row number should go from one to 20 without any surprises CU it’s just numbering the rows this dense rank should have rank one for the first and then these two should share the same rank because they have both have 50 and then the next rank is three so just as I’ve shown you in the spreadsheet similarly here you have 11 11 and then 12 rank uh instead starts off uh just the same uh smallest value has rank number one and the next two values have rank number two but then after using up two and two it’s like you’ve used up the three so you jump straight to four and after doing 15 and 15 you jump straight to 17 after doing 17 17 you jump straight to 19 and then the the highest number here is 20 which tells you how many rows you’re dealing with of course what you see here are window functions they work just the same as we I’ve shown you and so you could pick up Rank and you could order by value descending and then you will see you will find the inverse of that rank in the sense that the highest value item will give you rank one and it will go from there and the lowest value item will have sort of the the biggest rank number and and rank is often used like this you know the thing that has the most of what we want you know the biggest salary the biggest value the most successful product we rank it we make it so that it’s rank one it’s like the first in our race and then everyone else goes from there and so we often have actually we order by something descending when we calculate the rank and of course because these numbering functions are window functions they can also be combined with Partition by if you want to cut the data into subgroups so here’s an example on the fantasy characters table we are basically uh partitioning by class meaning that each row only sees the other rows that share the same class so archers only care about archers Warriors only care about Warriors and so forth and then within the class we are ordering by level descending okay so the highest levels come first and using this to rank the characters okay so if I go here then I can see that within the archers the highest level Archer has level 26 so they get the first Rank and then all the others is go down down from there and then we have our Warriors and the highest level Warrior is 25 and they also get rank one because they are being ranked within Warriors so this is like when you have races and there are categories this like when you have a race and there are categories within the race so there are like many people who arrive first because they arrive first in their category it’s not that everyone competes with everyone and so on and so forth you can see that each uh class of character has their own dedicated ranking and you can check the uh bigquery page on numbering function if you want to learn more about these functions you can see here the ones we’ve talked about rank row number and dense rank there are a few more but these are the ones that are most commonly used in SQL problems and because I know that it can be a bit confusing um to distinguish between row number dense Rank and rank here’s a visualization that you might find useful so let’s say that we have a list of values uh which are these ones and we are ordering them in descending order so you can see that there’s quite some repetition in these values and given this list of values how would these different numbering functions work on them right so here’s row number row number is easy it just um assigns a unique number to to each of them so it doesn’t matter that the values are sometimes the same you sort of arbitrarily pick um one to be one the other to be two and then you have three and then here you have 10 10 10 but it doesn’t matter you just want to order them so you uh do four five six and then finally seven dense rank is actually cares about the values being the same so 50 and 50 they both get one uh 40 gets two and then uh the 10 get three and then five gets four so easy the rank just grows uh using all the integer numbers dense rank is also assigning rank one to 50 and 50 but it’s also throwing away the two because there are two elements in here then the next one is getting rank three because the two has already been used and then the next batch 1011 is getting rank four but it’s also burning five and six and the next one then can only get rank seven so these are the differences between row number dance Rank and rank visualized we have now reached the end of our journey through the SQL fundamentals I hope you enjoyed it and I hoped that you learned something new you hopefully now have some understanding of the different components of SQL queries and the order in which they work and how they come together to allow us to do what we need with the data now of course learning the individual components and understanding how they work is only half the battle the other half of the battle is how do I put these pieces together how do I use them to solve real problems and in my opinion the response to that is not more Theory but it’s exercises go out there and do SQL challenges do SQL interviews find exercises or even better find some data that you’re interested in upload it in big query and then try to analyze it with SQL I should let you know that I have another playlist where I am solving 42 SQL exercises in postrest SQL and I think this can be really useful to get the other half of the course which is doing exercises and knowing how to face real problems with SQL and I really like this playlist because I’m using a free website a website that doesn’t require any sign up or any login uh it just works works and you get a chance to go there and do all of these exercises that cover all the theory that we’ve seen in this course and then after trying it yourself you get to see me solving it and my thought process and my explanation and I think it could be really useful if you want to deepen your SQL skills but in terms of uh how do I put it all together how do I combine all of this stuff I do want to leave you with another resource that I have created which is this table and this table shows you the fundamental moves that you will need to do whenever you do any type of data analytics and I believe that every sort of analytics that you might work on no matter how simple or complicated can ultimately be reduced to these few basic moves and what are these moves they should actually be quite familiar to you by now so we have joining and this is where we combine data from multiple tables based on some connections between columns and in SQL you can do that with the join then we have filtering filtering is when we pick certain rows and discard others so you know let’s look only at customers that joined after 2022 now how do you do that in SQL there are a few tools tools that you can use to do that the most important one is the wear filter and the wear filter comes in action right after you’ve loaded your data and it decides which rows to keep which rows to discard having does just the same except that it works on aggregated fields it works on fields that you’ve obtained after a group by qualify we actually haven’t seen it in this course because it’s not a universal component of SQL certain systems have it others don’t but qualify is basically also a filter and it works on the result of window functions and finally you have distinct which runs quite at the end of your query and it’s basically removing all duplicate rows and then of course you have grouping and aggregation and we’ve seen this in detail in the course you subdivide the data um on certain dimensions and then you calculate aggregate values within those Dimensions fundamental for analytics how do we aggregate in SQL we have the group by we have the window functions and for both of them we use aggregate functions such as sum average and so on and then we have column Transformations so this is where you apply logic uh arithmetic to transform columns combine column values and take take the data that you have in order to compute data that you need and we do this where we write the select right we can write calculations that involve our columns we have the case when which allows us to have a sort of branching logic and decide what to do based on some conditions and of course we have a lot of functions that make our life easier by doing specific next we have Union Union is pretty simp simple take tables that have the same columns and stack them together meaning put their rows together and combine them and finally we have sorting which can change how your data is sorted when you get the result of your analysis and can be also used in window functions in order to number or rank our data and these are really the fundamental elements of every analysis and every equal problem that you will need to solve so one way to face a problem even if you are finding it difficult is to come back to these fundamental components and try to think of how do you need to combine them in order to solve your problem and how can you take your problem and break it down to simpler operations that involve these steps now at the beginning of the course I promised you that uh we we would be solving a hard squl challenge together at the end of the course so here it is let us try now to solve this challenge applying the concepts in this course now as a quick disclaimer I’m picking a hard challenge because it’s sort of fun and it gives us um a playground to Showcase several Concepts that we’ve seen in the course and also because I would like to show you that even big hard scary ch Alles that are marked as hard and even have advanced in their name can be tackled by applying the basic concepts of SQL however I do not intend for you to jump into these hard challenges um from the very start it would be much better to start with basic exercises and do them step by step and be sure that you are confident with the basic steps before you move on to more advanced steps so if you have trouble uh approaching this problem or even understanding my solution don’t worry about it just go back to your exercises and start from the simple ones and then gradually build your way up that being said let’s look at the challenge marketing campaign success Advanced on strata scratch so first of all we have one table that we will work on for this challenge marketing campaign so marketing campaign has a few columns and it actually looks like this okay so there’s a user ID created that product ID quantity price now when I’m looking at the new table the one question that I must ask to understand it is what does each row represent and just by looking at this table I can have some hypotheses but I’m actually not sure what each row represents so I better go and read the text until I can get a sense of that so let’s scroll up and read you have a table of inapp purchases by user okay so this explains my table what does each row represent it represents an event that is a purchase okay so it means that user ID 10 bought product ID 101 in a quantity of three at the price of 55 and created that tells me when this happened so this happened 1st of January 2019 so great now I understand my table and now I can see what the problem wants from me let’s go on and read the question so I have a table of inapp purchases by users users that make their first inapp purchase are placed in a marketing campaign where they see call to actions for more Ina purchases find the number of users that made additional purchases due to the success of the marketing campaign the marketing campaign doesn’t start until one day after the initial app purchase so users that made one or multiple purchases on the first day do not count nor do we count users that over time purchase only the products they purchased on the first day all right so that was a mouthful okay so this on the first run it’s actually a pretty complicated problem so our next task now is to understand this text and to simplify it to the point that we can convert it into code okay and a good intermediate step before jumping into the code is to write some notes and we can use the SQL commenting feature for that so what I understand from this text is that users make purchases and we are interested in users that make additional purchases we’re interested in users who make additional purchases thanks to this marketing campaign how do we Define additional purchases additional purchase is defined as and the fundamental sentence is this one users that made one or multiple Pur purchases on the first day do not count so additional purchase happens after the first day right nor do we count users that over time purchase only the products they purchased on the first day so the other condition that we’re interested in is that it involves a product that was not bought the first day and finally what we want is the number of users so get the number of these users that should be a good start for us to begin writing the code so let us look at the marketing campaign table again and I remind you that each row represents a purchase so what do we need to find First in this table so we want to compare purchases that happen on the first day with purchases that happen the following day so we need a way to count days and what do we mean first day and following days do we mean the first day that the shop was uh open no we actually mean the first day that the user ordered right because the user signs up does the first order and then after that the marketing campaign starts so we’re interested in numbering days for each user such that we know what purchases happened on the first day what purchases happened on the second day third day and so on and what can we use to run a numbering by user we can use a window function with a numbering function right so I can go to my marketing campaign table and I can select the user ID and the date in which they bought something and the product ID for now now I said that I need a window function so let me start and Define the window now I want to count the days within each user so I will actually need to Partition by user ID so that each row only looks at the rows that correspond to that same user and then there is an ordering right there is a a sequence from the first day uh in which the user bought something to the second and the third and so on so my window will also need an ordering and what column in my table can provide an ordering it is created at and then what counting function do I need to use here well the the way to choose is to say what happens when the same user made two two different purchases on the same date what do I want my function to Output do I want it to Output two different numbers as a simple count or do I want them want it to Output the same number and the answer is that I wanted to Output the same number because all of the purchases that happened on day one need to be marked as day one and all the purchases that have happened on day two need to be marked as day two and so on and so the numbering function that allows us to achieve this is Rank and if you remember ranking is works just like ranking the winners of a race everyone who shares the same spot gets the same number right and this is what we want to achieve here so let us see what this looks like now and let us order by user ID and created at let us now see our purchases now user 10 started buying stuff on this day they bought one product and the rank is one Let’s us actually give a better name to this column so that it’s not just rank and we can call it user day all right so this user id10 had first user day on the this date and they brought one product then at a later date they had their second user day and they bought another product and then they had a third now user 14 started buying on this date this was their first user day they bought product 109 and then the same day they bought product 107 and this is also marked as user day one so this is what we want and then at a later day they bought another product and this is marked as user day three remember with rank you can go from 1 one to three because this the F the spot marked as one has eaten the spot Mark as two that’s not an issue in this problem so we are happy with this now if we go back to our notes we see that we are interested in users who made additional purchases and additional means that it happen s after the first day and how can we identify purchases that happened after the first day well there’s a simple solution for this we can simply filter out rows that have a user day one right all of the rows where the user day is one represent purchases that the user made on their first day so we can discard this and keep only purchase that happened on the following days now I don’t really have a way to filter on this uh window function because as you recall from the order of SQL operation the window function happens here and the wear filter happens before that so the wear filter cannot be aware of what happens in the window function and the having also happens before it so I need a different solution to filter on this field what I need to do is to use a Common Table expression so that I can break this query in two steps so I’m going to wrap this logic into a table called T1 or I can call it purchases for it to be more meaningful and if I do select star from purchases you will see that the result does not change but what I can do now is to use the wear filter and make sure that the user day is bigger than one and if I look here you will see that I have all purchases which happened after the users first day but there is yet one last requirement that I have to deal with which is that the purchase must happen after the first day and it must involve a product that the user didn’t buy on the first day so how can I comply with this requirement now for all of the rows that represent a purchase I need to drop the rows that involve a product ID that the user bought the first day so if I find out that user 10 bought product 119 on day one this purchase does not count I’m not interested in it so how can I achieve this in code I’m already getting all the purchases that didn’t happen on day one and then I want another condition so I will say and product ID not in and here I will say products that this user bought on day one right it makes sense so this is all the filters I need to complete my problem show me all the purchases that happened not on day one and also make sure that the user didn’t buy this product on day one so what I need to do is to add a subquery in here and before I do that let me give a Alias to this table so so that I don’t get confused when I call it again in the subquery so this first version of purchases that we’re using we could call it next days because we’re only looking at purchases that happen after the first day whereas in the subquery we want to look at purchases but we’re interested in the ones that actually happened on day one so we could call this first day and and we can use a wear filter to say that first day user day needs to be equal to one so this is a way that we can use to look at the purchases that happened on the first day now when we make this list we need to make sure that we are use looking at the same user right and to do that we can say end first day user ID needs to be the same as next day’s user ID and this ensures that we’re looking at the same user and we’re not getting confused between users and finally what do we need from the list of first day purchases we need the list of products so let me first see if the query runs so it runs there’s no mistakes and now let us review the logic of this query we have purchases which is basically a list of purchases with the added value that we know if it happened on day one on day two on day three and so on and then we are getting all of these purchases the ones that happened after day one and we are also getting the the list of products that they this user bought on day one and we are making sure to exclude those products from our final list and this is a correlated subquery because it is a specific SQL query that provides different results for every row that must run for every row because in the first row we need to get the list of products that user ID 10 has bought on day one and make sure that this product is not in it um and then when we go to another row such as this one we need to get the list of all products that user 13 bought on day one and make sure that 118 is not in those products so this is why it’s a correlated subquery and the final step in our problem is to get the number of these users so instead of selecting star and getting all of the C columns I can say count distinct user ID and if I run this I get 23 checking and this is indeed the right solution so this is one way to solve the problem and hopefully it’s not too confusing but if it is don’t worry it is after all an advanced problem if you go to solution here I do think however that my solution is a bit clearer than what strata scratch provides this is actually a bit of a weird solution but that’s ultimately up to you to decide and I am grateful to strata scratch for providing problems that I can solve for free such as this one welcome to postgress SQL exercises the website that we will use to exercise our SQL skills now I am not the author of this website I’m not the author of these exercises the author is Alis D Owens and he has generously created this website for anyone to use and it’s free you don’t even need to sign up you can go here right away and start working on it I believe it is a truly awesome website in fact the best at uh what it does and I’m truly grateful to Alis there for making this available to all the way the website works is pretty simple you have a few categories of exercises here and you can select a session and once you select a session you have a list of exercises you can click on an exercise and then here in the exercise view you have a question that you need to solve and you see a representation of your three tables we’re going to go into this shortly and then you see your expected results and here in this text box over here you can write your uh answer and then hit run to see if it’s the correct one the results will appear in this lower quadrant over here and if you get stock you can ask for a hint um and uh here there are also a few keyboard shortcuts that you can use and then after you submit your answer uh or if you are completely stuck you can go here and see the answers and and discussion and that’s basically all there is to it now let’s have a brief look at the data and see what that’s about and the data is the same for all exercises and what we have here is the data about a newly opened Country Club and we have three tables here members represents the members of the country club so we have their surname and first name their address their telephone and uh the the date that which they joined and so on and then we have the bookings so whenever a member makes a booking into a facility that event is stored into this table and then finally we have a table of facility where we have information about each facility and U in there we have some some tennis courts some badminton courts uh massage rooms uh and so on now as you may know this is a standard way of representing how data is stored in a SQL system so you have um the tables and for each table you see the columns and for each column you see the name and then the data type right so the data type is the type of data that is allowed into this column and as you know each column has a single data type and you are not allowed to mix multiple data types within each column so we have a few different data types here and they have the postgress um name so in postgress an integer is a whole number like 1 2 3 and a numeric is actually a FL floating Point number such as 2.5 or 3.2 character varying is the same as string it represents a piece of text and if you wonder about this number in round brackets 200 it represents the maximum limit of characters that you can put into this piece of text so you cannot have a surname that’s bigger than 200 characters and then you have a time stamp which represents a specific point in time and this is actually all the data types that we have here and finally you can see that the tables are connected so in the booking table every entry every row of this table represent an event where a certain facility ID was booked by a certain member ID at a certain time for a certain number of slots and the facility ID is the same as the facility ID field in facilities and the M ID field field is the same as the M ID or member ID field in members therefore the booking table is connecting to to both of these table and these logical connections will allow us to use joins in order to build queries that work on all of these three tables together and we shall see in detail how that works finally we have an interesting Arrow over here which represents a self relation meaning that the members table has a relation to itself and if you and if you look here this is actually very similar to the example that I have shown in my U mental models course um for each member we can have a recommended bu field which is the ID of another member the member who recommended them into the club and this basically means that you can join the members table to itself in order to get at the same time information about a specific member and about the member who recommended them and we shall see that in the exercises and clearly the exercises run on post SQL and postgress is one of the most popular open-source SQL systems out there postgress SQL is a specific dialect of SQL which has some minor difference es from other dialects such as my SQL or Google SQL that used is used by bigquery but it is mostly the same as all the others if you’ve learned SQL with another dialect you’re going to be just fine postgress sqle does have a couple of quirks that you should be aware about but I will address them specifically as we solve these exercises now if you want to rock these exercises I recommend keep keeping in mind The Logical order of SQL operations and this is a chart that I have introduced and explained extensively in my mental models course where we actually start with this chart being mostly empty and then we add one element at a time making sure that we understand it in detail so I won’t go in depth on this chart now but in short this chart represents the logical order of SQL operations these are are all the components that we can assemble to build our SQL queries they’re like our Lego building blocks for for SQL and these components when they’re assembled they run in a specific order right so the chart represents this order it goes from top to bottom so first you have from then you have where and then you have all the others and there are two very important rules that each operation can only use data produced above it and an operation doesn’t know anything about data produced below it so if you can keep this in mind and keep this chart as a reference it will greatly help you with the exercises and as I solve the exercises you will see that I put a lot of emphasis on coming back to this order and actually thinking in this order in order to write effective queries let us now jump in and get started with our basic exercises so I will jump into the first exercise which is retrieve everything from a table so here I have my question and how can I get all the information I need from the facilities table and as you know all my data is represented here so I can check here to see where I can find the data that I need now as I write my query I aim to always start with the front part why start with the front part first of all it is the first component that runs in The Logical order so again if I go back to my chart over here I can see that the from component is the first and that makes sense right because before I do any work I need to get my data so I need to tell SQL where my data is so in this case the data is in the facilities table next I need to retrieve all the information from this table so that means I’m not going to drop any rows and I’m going to select all the columns and so I can simply write select star and if I hit run I get the result that I need here in this quadrant I can see my result and it fits the expected results now the star is a shortcut for saying give me all of The Columns of this table so I could have listed each column in turn but instead I took a shortcut and used a star retrieve specific columns from a table I want to print a list of all the facilities and their cost to members so as always let’s start with the front part where is the data that we need it’s in the facilities table again and now the question is actually not super clear but luckily I can check the expected results so what I need are two columns from this table which is name and member cost so to get those two columns I can write select name member cost hit run and I get the result that I need so if I write select star I’m going to get all the columns of the table but if I write the name of specific columns separated by comma I will get uh only those columns specifically control which rows are retrieved we need a list of facilities that charge a fee to members so we know that we’re going to work with the facilities table and now we need to keep certain rows and drop others we need to keep only the rows that charge a fee to members so what component can we use in order to do this if I go back to my components chart I can see that right after from we have the we component and the we component is used to drop rows that we don’t need right so in after getting the facilities table I can see I can say where member cost is bigger than zero meaning that they charge a fee to members and finally I can get all of the columns from this control which rows are retrieved part two so like before we want the list of facilities that charge a fee to members but our filtering condition is now a bit more complex because we need that fee to be less than 150th of the monthly maintenance cost so I copied over the code from the last exercise we’re getting the data from our facilities list and we’re filtering for those where the member cost is bigger than zero and now we need to add a new condition which is that that fee which is member cost is less than 150th of the monthly maintenance cost so I can take monthly maintenance over here and divide it by 50 and I have my condition now when I have multiple logical conditions in the wear I need to link them with the logical operator so SQL can figure out how to combine them because the final result of all my conditions needs to be a single value which is either true or false right so let’s see how to do this in my mental models course I introduced the Boolean operators and how they work so you can go there for more detail but can you figure out which logical operator do we need here to chain these two conditions as suggested in the question the operator that I need is end so I can put it here here and what end does is that both of these conditions need to be true for the whole expression to evaluate to true and for the row to be kept so only the rows where both of these conditions are true will be kept and all other rows will be discarded now to complete my exercise I just need to select a few specific columns because we don’t want to return all the columns here and I think that I will cheat a bit by copying them from the expected results and putting them here but normally you would look at the table schema and figure out which columns you need and that completes our exercise basic string searches produce a list of all facilities with the word tennis in their name so where is the data we need it’s in the CD facilities table next question do I need all the rows from this table or do I need to filter out some rows well I only want facilities with the word tennis in their name so clearly I need a filter therefore I need to use the wear statement how can I write the wear statement I need to check the name and I need to keep only facilities which have tennis in their name so I can use the like statement here to say that the facility needs to have tennis in its name but what this wild card signify is that we don’t care what precedes tennis and what follows tennis it could be zero or more characters before it and after it we just care to check that they have tennis in their name and finally we need to select all all the columns from these facilities and that’s our result beware like I said before of your use of the quotes So what you have here is a string it’s a piece of text that uh allows you to do your match therefore you need single quotes if you as it’s likely to happen used double quotes you would get an error here and the error tells you that the column tenis the does not exist because double quotes are used to represent column names and not pieces of text so be careful with that matching against multiple possible values can we get the details of facilities with id1 and id5 so where is my data is in the facilities table and do I need all the rows from this table or only certain ones I need only certain rows because I want those that have id1 and id5 so I need to use a wear statement Now what are my conditions here their ID actually facility ID equals 1 and facility ID equals 5 so I have my two logical conditions now what operator do I need to use in order to chain them I need to use the or operator right because only one of these need needs to be true in order for the whole expression to evaluate to true and in fact only one of them can be true because it’s impossible for the idea of a facility to be equal to one and five at the same time therefore the end operator would not work and what we need is the or operator and finally we need to get all the data meaning all the columns about this facility so I will use select star the problem is now solved but now let’s imagine that tomorrow we need this query again and we need to include another id id 10 so what we can do is put or facility ID equals 10 but this is becoming a bit unwieldy right because imagine having a list of 10 IDs and then writing or every time and it’s it’s not very scalable as an approach approach so as an alternative we can say facility ID in and then list the values like one and five so if I take this and make it into my condition I will again get the same result I will get the the solution but this is a more elegant approach and it’s also more scalable because it’s much easier to come back and insert other IDs inside this list so this is a preferred solution in this case and logically what in is doing is looking at the facility ID for each row and then checking whether that ID is included in this list if it is it returns true therefore it keeps the row if it’s not returns false therefore it drops the row and we shall see a bit later that the in uh notation is also powerful because in this case we have a static list of IDs we know that we want IDs one and five but in more advanced use cases instead of a static list we could provide another query a SQL query or a subquery that would dynamically retrieve a certain list and then we could use that in our query so we shall see that in later exercises classify result into buckets produce a list of facilities and label them cheap or expensive based on their monthly maintenance so we want to get our facilities do we need a filter do we need to drop certain rows no we actually don’t we want to get all facilities and then we want to label them and we need to select the name of the facility and then here we need to provide the label so what SQL statement can we use to provide a text level label according to the value of a certain column what we need here is a case statement which implements conditional logic which implements a branching right it’s similar to the if else statements in other programming languages because if the monthly maintenance cost is more than 100 then it’s expensive otherwise it’s cheap so this call for a case statement now I always start with case and end with end and I always write these at the beginning so I don’t forget them and then for each condition I write when and what is the condition that I’m interested in monthly maintenance being above 100 that’s my first condition what do I do in that case I output a piece of text which says expensive and remember single quotes for test text next I could write the next condition explicitly but actually if it’s not 100 then it’s less than 100 so all I need here is an else and in that case I need to Output the piece of text which says cheap and finally I have a new column and I can give it a label I can call it cost and I get my result so whenever you need to put values into buckets or you need to label values according to certain rules that’s usually when you need a case statement working with dates let’s get a list of members who joined after the start of September 2012 so looking at these tables where is our data it’s in the members table so I will start writing this and now do I need to filter this table yes I only want to keep members that joined after a certain time and now how can I run this the condition on this table I can say where join date is bigger than 2012 September 01 so luckily in SQL and in postgress filtering on dates is quite intuitive even though here we have a time stamp that represents a specific moment in time up to the second we can say bigger or equal actually because we also want to include those who joined on the first day we can write bigger or equal and just specify the the date and SQL will fill in the the rest of the remaining values and the filter will work and next we want to get a few columns for these members so I will copy paste here select and this solves our query removing duplicates and ordering results we want an ordered list of the first 10 surnames in the members table and the list must not contain duplicates so let’s start by getting our table which is the members table now we want to see the surnames so if I write this I will see that there are surnames which are shared by members so there are actually duplicates here so what what can we do in SQL in order to remove duplicates we have seen in the mental models course that we have the distinct keyword and the distinct is going to remove all duplicate rows based on the columns that we have selected so if I run this again I will not see any duplicates anymore now the list needs to be ordered alphabetically as I see here in the expected results and we can do that with the order by statement and when you use order by on a piece of text the default behavior is that the text is ordered alphabetically and uh if I were to use Des sending then it would be ordered in Reverse alphabetical order however that’s not what I need I need it in alphabetical order so now I see that they are ordered and finally I want the first 10 surnames so how can I return the first 10 rows of my result I can do that with the limit statement so if I say limit 10 I will get the first 10 surnames and since I have ordered alphabetically I will get the first 10 surnames in alphabetical order and this is my result now going back to our map over here we have the from which gets a table we have a where which drops rows that we don’t need from that table and then all the way down here we have the select which gets the columns that we need and then we have the distinct right and the distinct needs to know which columns we need because it’s it drops duplicates based on these columns so in this example over here we’re only taking a single column surname so the distinct is going to drop duplicate surnames and then at the end of it all when all the processing is done we can order our results and then finally once our results are ordered we can do a limit to limit the number of rows that we return so I hope this makes sense combining results from multiple queries so let’s get a combined list of all surnames and all facility names so where are the surnames there in CD members and from CD m mbers I can select surname right and this will give me the list of all surnames and where are the facility names there are in CD facilities and I could say select name from CD facilities and I would get a list of all the facilities now we have two distinct queries and they both produce a list or a column of text values and we want to combine them what does it mean we want to stack them on top of each other right and how does that work well if I just say run query like this I will get an error because I have two distinct query here queries here and they’re not connected in any way but when I have two queries or more defining tables and I want to stack them on top of each other I can use the union statement right and if I do Union here I will uh get what I want because all the surnames will be stacked uh vertically with all the names and I will get a unique list containing both of these columns now as I mentioned in the mental models course typically when you have just Union uh it means Union distinct and actually other systems like bigquery don’t allow you to write just Union they want you to specify Union distinct and what this actually does is that after stacking together these two tables it removes all duplicate rows and uh the alternative to this is Union all which um does not do this it actually keeps all the rows and as you know we have some duplicate surnames and then we get them here and it doesn’t fit with our result but if you write just Union it will be Union distinct and you won’t have any duplicates and if you look at our map for The Logical order of SQL operations we are getting the data from a certain table and uh filtering it and then doing all sorts of operations and um on on this data and then we are selecting The Columns that we need and then we can uh remove the the duplicates from this one table and then what comes next is that we could combine this table U with other tables right we can tell SQL that we want to Stack this table on top of another table so this is where the union comes into play and only after we have combined all the tables only after we have stacked them all up on top of each other we can order the results and limit the results also remember and I showed this in detail in the mental models course um when I combine two or more table tables with a union what I need is for them to have the exact same number of columns and all of the columns need to have the same data type so in this case both tables have one column and this column is a text so the the union works but if I were to add another column here and it’s an integer column it would not work because the union query must have the same number of columns right I will get an error however if I were to add an integer column in the second position in both tables they would work again because again I have the same number of columns and they have the same data type simple aggregation I need the sign up date of my last member so I need to work with the members table and we have a field here which is join date and I need to get the latest value of this date the time when a member last joined right so how can I do that I can take my join date field and run an aggregation on top of it what is the correct aggregation in this case it is Max because when it comes to dates Max will take the latest date whereas mean will take the earliest date and I can label this as latest and get the result I need now how aggregations work they are uh functions that look like this you write the name of the function and then in round brackets you provide the arguments the first argument is always the column on which to run the aggregation and what the aggregation does is that it takes a list of values could be 10 100 a million 10 million it doesn’t matter it takes a long list of values and it compresses this list to a single value it um does like we’ve seen in this case taking all of the dates and then returning the latest date now to place this in our map we get the data from the table we filter it and then sometimes we do a grouping which we we shall see later in the exercises but whether we do grouping or not here we have aggregations and if we haven’t done any grouping the aggregation works at the level of all the rows so in the absence of grouping as in this case the aggregation will look at all the rows in my table except for the rows that I filtered away but otherwise it will look at all the rows and then it will compress them into a single value more aggregation we need the first and last name of the last member who signed up not just the date so in the previous exercise we saw that we can say select Max join date from members and we would get the last join date the date when the last member signed up right so given that I want the first and the last name you might think that you can say first name and surname in here but this actually doesn’t work this gives an error the error is that the column first name must appear in the group by clause or be used in a aggregate function now the meaning behind this error and how to avoid it is described in detail in the mental models course in the group by section but the short version of it is that what you’re doing here is that with this aggregation you’re compressing join date to a single value but you’re doing no such compression or aggregation for first name and surname and so SQL is left with the um instruction to return something like this and as you can see here we have a single value but for these columns we have multiple values and this does not work in SQL because you need all columns to have the same number of values and so it it throws an error and what we really need to do here is to take this maximum join date and use it in a wear filter because we only want to keep that row which corresponds to the latest join date so we can take the members table and get the row where join date is equal to the max join date and from that select the name and the surname unfortunately this also doesn’t work so what we saw in the course is that you cannot you’re not allowed to use aggregations inside wear so you cannot use max inside where and the reason why is that actually pretty clear because aggregations happen at this stage in the in the process and aggregations need to know whether a group ey has occurred or not they need to know whether they have to happen over all the rows in the table or only within the groups defined by the group ey and when we are at the where stage the groupy hasn’t happened yet so we don’t know at which level to execute the aggregations and because of this we are not allowed to do aggregations inside the where statement so how can we solve the problem now well a a sort of cheating solution would be if we knew the exact value of join date we could place it here and then our filter would work we’re not using an aggregation and we could put join date in here to display it as well and that would would work however this is a bit cheating right because um the maximum join date is actually a dynamic value it will change with time so we don’t want to hardcode it we want to actually um compute it but because this is not allowed what we actually need is a subquery and the subquery is a SQL query that runs within a query to return a certain result and we can have a subquery by opening round brackets here and write writing a a query and in this query we need to go to the members table and select the maximum join date and this is our actual solution so in this execution you can imagine that SQL will go here inside the subquery run this get the maximum jointed place it in the filter uh keep only the row for the latest member who has joined and then retrieve what we need about this member let us now move to the joints and subqueries exercises the first exercise retrieve the start times of members bookings now we can see that the information we need is spread out into tables because we want the start time for bookings that and that information is in the bookings table but we want to filter to only get members named David farel and the name of the member is contained in the members table so because of that we will need a join so if we briefly look at the map for the order of SQL operations we we can see here that from and join are really the same uh step um and how this works is that in the from statement sometimes uh all my data is in one table and then I just provide the name of that table but sometimes I need to combine two or more different tables in order to get my data and in that case I would use the join but everything in SQL works with tables right so when I when I take two or more tables and combine them together at the end all I get is just another table and this is why from and join are actually the same component and they are the same step so as usual let us start with the front part and we need to take the booking table and we need to join it on the members table and I can give an alas to each table to make my life easier so I will call this book and I will call this mem and then I need to specify The Logical condition for joining this table and The Logical condition is that the M ID column in the booking table is really the same thing as the M ID column in the members table concretely you can imagine um SQL going row by Row in the booking table and looking at the M ID and then checking whether this m ID is present in the members table and if it’s present it combines the row uh the current Row from bookings with the matching Row for members does this with all the matching rows and then drops rows which don’t have a match and we saw that in detail in the mental models course so I’m not going to go in depth into it now that we have our table which is uh comes from the joint of members and bookings we can properly properly filter it and what we want is that the first name column is David in the column which comes from the members table right so m. first name is indicating the parent table and then the column name and the surname is equal to FAL and remember single quotes when using pieces of text this is a where filter you have two logical conditions and then we use the operator end because both of them need to be true so now we have uh filtered our data and finally we need to select the start time and that’s our query now remember that when we use join in a query what’s implied is that we are using inner join and there are several types of join but inner joint is the most common so it’s the default one and what inner joint means is that it’s going to return uh from the two tables that we’re joining is going to return only the rows that have a match and all the row that don’t have a match are going to be dropped so if there’s a row in bookings and it has a m ID that doesn’t exist in the members table that row will be dropped and conversely if there’s a row in the members table and it has a m ID that is not referenced in the booking table that row will also be dropped and that’s an inner join work out the start times of bookings for tennis courts so we need to get the facilities that are actually tennis courts and then for each of the facility we’ll have several bookings and we need to get the start time for those uh bookings and it will be in a specific date so we know that we need the data from these two tables because the name of the facility is here but the data about the bookings is here so I will go from CD facilities join CD bookings on what are the fields that we can join on logically now let me first give an alias to these tables so I will call this fox and this I will call book and now what I need to see is that the facility ID matches on both sides now we can work work on our filters so first of all I only want to look at tennis courts and if you look at the result here um it means that in the name of the facility we want to see tennis and so we can filter on uh string patterns on text patterns by using the like uh command so I can take facilities name and get it like tennis and the percentage signs are um wild cards which means that tennis could be preceded and followed by zero or more characters we don’t care we just want to get those strings that have tennis in them but that’s not enough as a condition we also need the booking to have happened on a specific date so I will put an end here so end is the operator we need because we’re providing two logical conditions and they both need to be true so end is what we need and then I can take the start time from the booking table and um say that it should be equal to the date provided in the instructions because I want the booking to have happened in this particular date however this will not work so I can actually complete the query and show you that it will not work because here we get zero results so can you figure out why this um command here did not work now I’m going to write a few comments here and uh this is how you write them and they are just pieces of text they’re not actually executed as code and I’ll just use them to show you what’s going on so the value for start time looks like this so this is a time stamp and is showing a specific point in time but the date that we are providing for the comparison looks like this so as you can see we have something that is uh less granular because we we’re not showing all of this data about hour minute and uh and second now in order to compare these two things which are different SQL automatically fills in uh this date over here and what it does is that since there’s nothing there it puts zeros in there and now that it has made this um extension it’s going to actually compare them so when you look at this uh comparison over here between these two elements this comparison is false false because the hour is different now when we write this uh filter command over here SQL is looking at every single start time and then comparing it with this value over here which is the very first moment of that date but there’s no start time that is exactly like this one so basically this is always false and thus we get uh zero rows in our result so what is the solution to this before when we take a start time from the data before comparing it we can put it into the date function and if I take my example here if I put it into the date function it’s going to drop that extra information about hour minute and second and it’s only going to keep uh the information about the date so once I do this if I uh if I pass it to the date function before comparing it to my reference date now this one is going to become the result which is this one and then I’m going to compare it with my reference date and then this is going to be true so all this to say that before we compare start time with our reference date we need to reduce its granularity and we need to reduce it to its uh to its date so if I run the query now I will actually get my start times and after this I just need to add the name and finally I need to order by time so I need to order bu um book start time there is still a small error here so sometimes you just have to look at what you get and what’s expected and if you notice here we are returning data about the table tennis facility but we’re actually just interested in tennis court so what are we missing here the string filter is not precise enough and we need to change this into tennis court and now we get our results produce a list of all members who have recommended another member now if we look at the members table we have all these data about each member and then we know if they were recommended by another member and recommended by is the ID of the member who has recommended them and because of this the members table like we said has a relation to itself because one of its column references its ID column so let’s see how to put this in practice so to be clear I simply want a list of members who appear to have recommended another member so if I wanted just the IDS of these people my task would be much simpler right I would go to the members table and then I could select recommended by and then I will put a distinct in here to avoid repetitions and what I would get here is the IDS of all members who have recommended another member however the problem does not want this because the problem wants the first name and Sur name of these uh of these people so in order to get the first name and the name of these people I need to plug this ID back into the members table and get the the data there so for example if I went to the members table and I selected everything where the M ID is 11 then I would get the data for this first member but now I need to do this for all members so what I will have to do is to take the members table and join it to itself and the first time I take the table I’m looking at the members quite simply but the second time I take the members table I’m looking at data about the recommenders of the members so I will call this second instance re so both of these they come from the same table but they’re now two separate instances and what is the logic to join these two tables the members table has this recommended by field and we take the ID from recommended by and we plug it back into the table into M ID to get the data about the recommenders and now we can go into the recommenders which we got by plugging that ID and get their first name and surname I want to avoid repetition because a member may have been recommending multiple members but I want to avoid repetition so I will put a distinct to make sure that I don’t get any uh repeated rows at the end and then finally I can order by surname and first name and I get my result so I encourage you to play with this and experiment a bit until it is clear and in my U mental models course I go into depth into the self joint and uh do a visualization in Google Sheets that also makes it uh much clearer produce a list of all members along with a recommender now if we look at the members table we have a few column and then we have the recommended by column and sometimes we have the ID of another member who recommended this member um it can be repeated because the same member may have recommended multiple people and then sometimes this is empty and when this is empty we have a null in here which is the value that SQL uses to represent absence of data now let us count the rows in members so you might know that to count the rows of a table we can do a simple aggregation which is Count star and we get 31 and let’s just make a note of this that members has 31 rows because in the result we want a list of all members so we must ensure that we return 31 rows in our results now I’m going to delete this select and as before I want want to go for each member and check the ID they have here in recommended bu and then plug this back into the table into M ID so I can get the data about the recommender as well and I can do that with a self jooin so let me take members and join on itself and the first time I will call it Ms and the second time I will call it Rex and the logic for joining is that in Ms recommended by is the same um is connected to to Rex M ID so this is taking the ID in the recommended by field and plugging it back into me ID to get the data about the recommender now what do I want from this I want to get the first name of the member and the last name uh surname and then the first name and last name of the recommender uh surname great so it’s starting to look like the right result but how many rows do we think we have here and in order to count the rows I can do select count star from and then if I simply take this table uh if I simply take this query and en close it in Brackets now this becomes a a subquery so I can ah the subquery must have an alias so I can give it an alias like this and I get 22 so how this works is that first SQL will compute the content of the subquery which is the table that we saw before and then it will uh we need to assign it an alas otherwise it doesn’t work this changes a bit by System but in post you need to do this so we we call it simply T1 and then we run a count star on this table to get the number of rows and we see that the result has 22 rows and this is an issue because we saw before that members has 31 rows and that we want to return all of the members therefore our result should also have 31 rows so can you figure figure out why are we missing some rows here now the issue here is that we are using an inner join so remember when we don’t specify the type of joint it’s an inner joint and what does an inner joint do it keeps only rows that have matches so if you we saw before that in members sometimes this field is empty it has a null value because U you know maybe the member wasn’t recommended by anyone maybe they just apply it themselves and what happens when we use this in an inner joint and it has a null value the row for that me member will be dropped because obviously it cannot have a match with M ID because null cannot match with with anything with any ID and so that row is dropped and we lose it however that’s not what we want to do therefore instead of an inner join we need to use a left join here the the left join will look at the left table so the table that is left of the join command and it will make sure to keep all the rows in that table even the rows that don’t have a match in the rows that don’t have a match it will not drop them it will just put a null in the values that correspond to the right table and if I run the count again uh I will get 31 so now I have I’m keeping all the members and I have the number of rows that I need so now I can get rid of all of these because I know I have the right amount of of rows and I can um get my selection over here and it would actually help if we could make this a bit uh more ordered and a assign aliases to the columns so I will follow the expected results here and call this m first name me surname W first name Rec surname now we have the proper labels and you can see here that we always have the name of the member but some member weren’t recommended by anyone and therefore for the first and last name of the recommender we simply have null values and this is what the left join does the last step here is to order and we want to order by the last name and the first name of each member and we finally get our result so typically you use inner joints which is the default joint because you’re only interested in the rows from both tables that actually have a match but sometimes you want to keep all the data about one table and then you would put that table on the left side and do a left join as we did in this case produce a list of all members who have used a tennis court now now for this problem we need to combine data from all our tables because we need to get look at the members and we need to look at their bookings and we need to check what’s the name of the facility for their bookings so as always let us start with the front part and let us start by joining together all of these tables CD facilities on facility ID and then I want to also join on members and that is my join so we can always join two or more tables in this case we’re joining three tables and how this works is that the first join creates a new table and then this new table is joined with the with the next one over here and this is how multiple joints are managed now I have my table which is the join of all of these tables and um we we’re only interested in members who have used the tennis court if a member has made no bookings um we are we don’t we’re not interested in that member and so it’s okay to have a join and not a left join and we’re for each booking we want to see the name of the facility and if there was a booking who didn’t have the name of the facility we wouldn’t be interested in that booking anyway and so um this joint here also can be an inner join and doesn’t need to be a left join this is how you can think about whether to have a join or left join now we want the booking to include a tennis court so we can filter on this table and we will look at the name of the facility and uh make sure that it has tennis court in it with the like operator and now that we have filtered we can get the first name and the surname of the member and we can get the facility name so here we have a starting result now in the expected result we have merged the first name and the surname into a single string and um in SQL you can do this with a concatenation operator which is basically taking two strings and putting them together into one string now if I do this here I will get um something like this and so this looks a bit weird and what I want to do here is to add an empty space in between and again concatenate it and now the names will look uh will look fine I also want to label this as member and this other column as facility to match the expected results next I need to ensure that there is no duplicate data so at the end of it all I will want to have distinct in order to remove duplicate rows and then I want to order the final result by member name and facility name so order by member and then facility and this will work because the order bu coming second to last coming at the end of our logical order of SQL operations over here the order by is aware of the alas is aware of the label that I have that I have put on the columns and here I get the results that I needed not a lot happening here to be honest it’s just that we’re joining three tables instead of two but it still works um just like uh any other join and then concatenating the strings filtering according to the facility name and then removing duplicate rows and finally ordering produce a list of costly bookings so we want to see all bookings that occurred in this particular particular day and we want to see how much they cost the member and we want to keep the bookings that cost more than $30 so clearly in this case we also need the information from from all tables because if you look at the expected results we want the name of the member which is in the members table the name of the facility which is in the facilities table and the cost for which we will need the booking table so we need to start with a join of these three tables and since we did it already in the last exercise I have copied the code for that uh join so if you want more detail on this go and check the last exercise as well as I have copied the code to get the first name of the member by concatenating strings and the name of the of the facility now we need to calculate the cost of each booking so how does it work looking at our data so we have here a list of bookings and um a booking is defined as a number of slots and a slot is a one uh is a 30 minute usage of that facility and then we also have mid which tells us whether the member is a guest or not I mean whether the person is a guest or a member because if mid is zero then that person is a guest otherwise that person is a member and then I also know the facility that this person booked and if I go and look at the facility it has uh two different prices right one price uh is for members the other price is for guests and the price applies to the slots so we have all of the ingredients that we need for the cost in our join right and to convince ourselves of that let us actually select the here so in Booking I can see facility ID member ID and then slots and then in facility I can see the member cost the guest cost and I guess that’s all I need really to calculate the cost and as you can see after the join I’m in a really good position because for each row I do have all of these values placed on each row so now I just have to figure out how to combine all of these values in order to get the cost now the way that I can get the cost is that I can look at the number of slots and then I need to multiply this by the right cost which is either member cost or guest cost and how do I know which of these to pick if it depends on the M ID if the M id M ID is zero then I will use the guess cost otherwise I will use the member cost so let me go back to my code here and after this I can say I want to take the slots and I want to multiply it by either member cost or guest cost now how can I put some logic in here that will choose uh either member cost or guest cost based on the ID of this person what can I use in order to make this Choice whenever I have such a choice to make I need to use a case statement so I can start with a case statement here and I will already write the end of it so that I don’t forget it and then in the case statement M what do I need to check for I need to check that the member ID is zero in that case I will use the guest cost and in all other cases I will use the member cost so I’m taking slots and then I’m using this case when to decide by which column I’m going to multiply it and this is actually my cost now let’s take a look at this and so I get this error that the column reference M ID is ambiguous so can you figure out why I got this error what’s happening is that I have joined U multiple tables and the M ID column appears twice now in my join and so I cannot refer to it just by name because SQL doesn’t know which column I want so I have to to reference the parent of the column every time I use it so here I will say that it comes from the booking table and now I get my result so if I see here then um I can see that I have successfully calculated my cost and let’s look at the first row uh first it’s um the me ID is not zero therefore it’s a member and here the member cost is zero meaning that this facility is free for members so regardless of the slots the cost will be zero and let’s look at one who is a guest so this one uh is clearly a a guest and they have uh taken one slot and the member cost is zero but uh so it’s free for members but it costs five per slot for guests so the total cost is five So based on this sanity check the cost looks good now I need to actually filter my table because we have um we should consider only bookings that occurred in a certain day so after creating my new table uh and joining I can write aware filter to drop the rows that I don’t need and I can say this is the the time column that I’m interested in the start time needs to be equal to this date over here and we have seen before that this will not work because start time is a Tim stamp it also shows hour um minute and seconds whereas here is just a date so this comparison will fail and so before I do the comparison I need to take this and reduce it to a date so that I’m comparing Apples to Apples on the time check that that didn’t break anything now we should have significantly fewer rows so now what we need to do is to only keep rows that have a cost which is higher than 30 so can I go here and say end cost bigger than 30 no I cannot do it column cost does not exist right typical mistake but if you look at the logical order of SQL operations first you have the sourcing of the data then you have the wear filter and then all of the logic um by which we calculate the cost happens here and the label cost happens here as well so we cannot um filter on this column on the column cost because the we component has no idea about the uh column cost so this will now work but what we can do is to take all of the logic we’ve done until now and wrap it in round brackets and then introduce a Common Table expression and call this T1 so I will say with T1 as and then I can from T1 and now I can use my filter right so cost bigger than 30 I can select star from this table and I’m starting to get somewhere because the cost has been successfully filtered now I have a lot of columns that I don’t want in my final result that I used to help me reason about the cost so I want to keep member and I want to keep the facility but I don’t want to keep any of these great now as a final step I need to order by cost descending and there’s actually a issue that I have because I copy pasted code from the previous exercise I kept a distinct and you have to be very careful with this especially if you copy paste code anyway for learning it would be best to write it always from scratch but the distinct will remove uh rows that are duplicate and can actually cause an issue now I remove the distinct and I get the um solution that I want and if you look here we have if you look at the last two rows you can see that they’re absolutely identical and so the distinct would remove them but there are two uh bookings that happen to be just the same uh in our data and we want to keep them we don’t want to delete them so having distinct was a mistake in this case to summarize what we did here first we joined all the tables so we could have all the columns uh that we needed side by side and then we filtered on on the date pretty straightforward and then we took the first name and surname and um concatenated them together as well as the facility name and then we computed the cost and to compute the cost we got the number of slots and we used used a case when to multiply this by either the guest cost or the member cost according to the member’s ID and at the end we wrapped everything in a Common Table expression so that we could filter on this newly computed value of cost and keep only those bookings that had a cost higher than 30 now I am aware that the question said not to use any subqueries technically I didn’t because this is a common table expression but if you look at the author solution it is slightly different than ours so here they did basically the same thing that we did to compute the the cost except that in the case when they inserted the whole uh expression which is fine works just the same the difference is that um in this case they added a lot of logic in the we filter so that they could use a we filter in the first query so clearly they didn’t use any columns that were added at the stage of the select they didn’t use cost for example because like we said that wouldn’t be possible so what they did is that they added the date filter over here and then in this case they added a um logical expression and in this logical expression either one of these two needed to be true for us to keep the row either the M ID is zero meaning that it’s a it’s a guest and so the calculation based on Guess cost ends up being bigger than 30 or the M ID is not zero which means it’s a member and then this calculation based on the member cost ends up being bigger than 30 so this works I personally think that there’s quite some repetition of the cost calculation both by putting it in the we filter and by uh putting it inside the case when and so I think that uh the solution we have here is a bit cleaner because we’re only calculating cost once uh in this case and then we’re simply referencing it thanks to the Common Table expression so if you look at the mental models course you will see that I warmly recommend not repeating logic in the code and using Common Table Expressions as often as possible because I think that they made the code uh clearer and um simpler to to understand produce a list of all members and the recommender without any joins now we have already Sol solved this problem and we have solved it with a self join as you remember we take the members table and join it on itself so that we can get this uh recommend by ID and plug it into members ID and then see the names of both the member and the recommender side by side but here we are challenged to do it without a join so let us go to the members table and let us select the first name and the surname now we actually want want to concatenate these two into a single string and call this member now how can we get data about the recommender without a self-join typically when you have to combine data you always have a choice between a join in a subquery right so what we we can do is to have a subquery here which looks at the recommended by ID from this table and um goes back to the members table and gets the the data that we need so let’s see how that would look let us give an alias to this table and call it Ms and now we need to go back to this table inside the subquery and we can call it Rex and we want to select again the first name and surname like we’re doing here and how are we able to identify the right row inside this subquery we can use aware filter and we want the Rex M ID to be equal to the Mims recommended by value and once we get this value we can call this recommender and now we want to avoid duplicates so after our outer select we can say distinct which will remove any duplicates from the result and then we want to sort I guess by member and recommender and here we get our result so replacing a join with a subquery so we go row by Row in members and then we take the recommended by ID and then we query the members table again inside the subquery and we use the wear filter to plug in that recommended by and find the row where the mem ID is equal to it and then getting first name and surname we get the data about the recommender and uh and that’s how we can do it in the mental models course we discuss the subqueries and um and this particular case we talk about a correlated subquery why is this a correlated subquery because you can imagine that the the query that is in here it runs again for every row because for every row row I have a different value recommended by and I need and I need to plug this value into the members table to get the data about the recommender so this is a correlated subquery because it runs uh every time and it is different for every row of the members table produce a list of costly bookings using a subquery so this is the exact exercise that we did before and as you will remember uh we actually ignored it instructions a bit and we did use not a subquery but a Common Table expression and by reference this is the code that we used and this code works with that exercise as well and we get the result so you can go back to that exercise to see the logic behind this code and why this works and if we look at the author’s uh solution they are actually using a subquery instead of a common table expression so they have an outer quer query which is Select member facility cost from and then instead of the from instead of telling the name of the table they have all of this logic here in this subquery which they call bookings and finally they they add a filter and order now this is technically correct it works but I’m not a fan of uh of writing queries like this I prefer writing them like this as a common table expression and I explain this in detail in my mental models course the reason I prefer this is because U it doesn’t break queries apart so in my case this is one query and this is another query and it’s pretty easy and simple to read however in this case you will start reading this query and then it is broken uh in in two by another query and when people do this sometimes they go even further and here when you have the from instead of a table you have yet another subquery it gets really complicated um so because of these uh two approaches are equivalent I definitely recommend going for a Common Table expression every time and avoiding subqueries unless they are really Compact and you can fit them in one row let us now get started with aggregation exercises and the first problem count the number of facilities so I can go to the facilities table and then when I want to count the number of rows in a table and here every row is a facility I can use the countar aggregation and we get the count of facilities so what we see here is a global aggregation and when you run an aggregation without having done any grouping it runs on the whole table therefore it will take all the rows of this table no matter how many compress them into one number which is determined by the aggregation function in this case we have a count and it returns a total of nine rows so in our map aggregation happens right here so we Source the table we filtered it if needed and then we might do a grouping which we didn’t do in this case but whether we do it or not aggregations happen here and if grouping didn’t happen the aggregation is at the level of the whole table count the number of expensive facilities this is similar to the previous exercise we can go to the facilities table but here we can add a filtering because we’re only interested in facilities that have guest cost greater than or equal to 10 and now once again I can get my aggregation count star to count the number of rows of this resulting table looking again at our map why does this work because with the from We’re sourcing the table and immediately after the wear runs and it drops unneeded rows and then we can decide whether to group by or not and in our case in this case we’re not doing it um but then the aggregations Run so by the time the aggregations run I’ve already dropped the rows in the wear and this is why in this case after dropping some rows the aggregation only sees six rows which is what we want count the number of recommendations each member makes so in the members table we have a field which is recommended by and here is the ID of the member who recommended the member that that this row is about so now we want to get all these uh recommended by values and count how many times they appear so I can go to my members table and what I need to do here is to group by recommended by so what this will do is that it will take all the unique values of this column recommended by and then you will allow me to do an aggregation on all of the rows in which those values occur so now I can go here to select and call this column again and if I run this query I get all the unique values of recommended buy without any repetitions and now I can run an aggregation like count star what this will do is that for recomend recomended by value 11 it will run this aggregation on all the rows in which recommended by is 11 and the aggregation in this case is Count star which means that it will return the number of rows in which 11 appears which in the result happens to be one and so on for all the values what I also want to do is to order by recommended buy to match the expected results now what we get here is almost correct we see all the unique values of this column and we see the number of times that it appears in our data but there’s one discrepancy which is this last row over here so in this last row you cannot see anything which means that it’s a null value so it’s a value that represents absence of data and why does this occur if you look at the original recommended by column there is a bunch of null values in this column because there’s a bunch of member that have null in recommended by so maybe we don’t know who recommended them or maybe they weren’t recommended they just applied independently when you group bu you take all the unique values of the recommended by column and that includes the null value the null value defines a group of its own and the count works as expected because we can see that there are nine members for whom we don’t have the recommended by value but the solution does not want to see this because we only want to see the number of recommendations each member has made so we actually need to drop this row therefore how how can I drop this row well it’s as simple as going to uh after the from and putting a simple filter and saying recommended by is not not null and this will drop all of the rows in which in which that value is null therefore we won’t appear in the grouping and now our results are correct remember when you’re checking whether a value is null or not you need to use the is null or is not null you cannot actually do equal or um not equal because um null is not an act ual value it’s just a notation for the absence of a value so you cannot say that something is equal or not equal to null you have to say that it is not null let’s list the total slots booked per facility now first question where is the information that I need the number of slots booked in the is in the CD bookings and there I also have the facility ID so I can work with that table and now how can I get the total slots for each facility I can Group by facility ID and then I can select that facility ID and within each unique facility ID what type of uh aggregation might I want to do in every booking we have a certain number of slots right and so we want to find all the bookings for a certain facility ID and then sum all the slots that are being booked so I can write sum of slots over here and then I want to name this column total slots uh looking at the expected results but this will actually not work because um it’s it’s two two separate words so I actually need to use quotes for this and remember I have to use double quotes because it’s a column name so it’s always double quotes for the column name and single quotes for pieces of text and finally I need to order by facility ID and I get the results so for facility ID zero we looked at all the rows where facility ID was zero and we squished all of this to a single value which is the unique facility ID and then we looked at all the slots that were occurring in these rows and then we compress them we squished them to a single value as well using the sum aggregation so summing them all up and then we get the slum the sum of the total slots list the total slots booked per facility in a given month so this is similar to the previous problem except that we are now isolating a specific time period And so let’s us think about how we can um select bookings that happened in the month of September 2012 now we can go to the bookings table and select the start time column and to help our exercise I will order by start time uh descending and I will limit our results to 20 and you can see here that start time is a time stamp call and it goes down to the second because we have year month day hour minutes second so how can we check whether any of these dates is corresponds to September 2012 we could add a logical check here we could say that start time needs to be greater than or equal to 2012 September 1st and it needs to be strictly smaller than 2012 October 1st and this will actually work as an alternative there is a nice function that we could use which is the following date trunk month start time let’s see what that looks like so what do you think this function does like the name suggests it truncates the date to a specific U granularity that we choose here and so all of the months are reduced to the very first moment of the month in which they occur so it is sort of cutting that date and removing some information and reducing the granularity I could of course uh have other values here such as day and then every um time stem here would be reduced to its day but I actually want to use month and now that I have this I can set an equality and I can say that I want this to be equal to September 2012 and this will actually work and I also think it’s nicer than the range that we showed before now I’ve taken the code for the previous exercise and copied it here because it’s actually pretty similar except that now after we get bookings we need to insert a filter to isolate our time range and actually we can use this logical condition directly I’ll delete all the rest and now what I need to do is to change the ordering and I actually need to order by the the total slots here and I get my result to summarize I get the booking table and then I uh take the start time time stamp and I truncate it because I’m only interested in the month of that of that time and then I make sure that the month is the one I actually need and then I’m grouping by facility ID and then I’m getting the facility ID and within each of those groups I’m summing all the slots and finally I’m ordering by this uh column list the total slots booked per facility per month in the year 2012 so again our data is in bookings and now we want to see how we how can we isolate the time period of the year 2012 for this table now once again I am looking at the start time column from bookings uh to see how we can extract the the year so in the previous exercise we we saw the date trunk function and we could apply it here as well so we could say date trunk start time um Year from start time right because we want to see it at the Year resolution and then we will get something like this and then we could check that this is equal to 2012 0101 and this would actually work but there’s actually a better way to do it what we could do here is that we could say extract Year from start time and when we look at here we got a integer that actually represents the year and it will be easy now to just say equal to 2012 and make that test so if we look at what happened here extract is a different function than date time because extract is getting the year and outputting it as an integer whereas date time is still outputting a time stamp or a date just with lower granularity so you have to use one or another according to your needs now to proceed with our query we can get CD bookings and add a filter here and insert this expression in the filter and we want the year to be 2012 so this will take care of isolating our desired time period next we want to check the total slots within groups defined by facility fac ID and month so we want a total for each facility for each month as you can see here in the respected results such that we can say that for facility ID zero in the month of July in the year 2012 we uh booked to 170 slots so let’s see how we can do that this basically means that we have to group by multiple values right and facility ID is easy we have it however we do not have the month so how can we extract the month from the start time over here well we can use the extract function right which is which we just saw so if we write it like this and we put month here um this function will look at the month and then we’ll output the month as an actual integer and um the thing is that I can Group by uh the names of columns but I can also Group by Transformations on columns it works just as well SQL will compute uh this expression over here and then it will get the value and then it will Group by that value now when it comes to getting the columns what I usually do is that when I group by I want to see the The Columns in which I grouped so I just copy what I had here and I add it to my query and then what aggregation do I want to do within the groups defined by these two columns I have seen it in the previous exercise I want to sum over the the slots and get the total slots I also want to take this column over here and rename it as month and now I have to order by ID and month and we get the data that we needed so what did we learn with this exercise we learned to use the extract function to get a number out of a date and we use that we have used uh grouping by multiple columns which simply defines a group as the combination of the unique values of two or more columns that’s what multiple grouping does we have also seen that not only you can Group by providing a column name but you can also Group by a logical operation and you should then reference that same operation in the select statement so that you can get the uh value that was obtained find the count of members who have made at least one booking so where is the data that we need it’s in the bookings table and for every booking we have the ID of the member who has made the booking so I can select this column and clearly I can run a count on this column and the count will return the number of nonnull values however this count as you can see is quite inflated What’s Happening Here is that uh a single member can make any number of bookings and now we’re basically counting all the bookings in here but if I put distinct in here then I’m only going to count the unique values of mid in my booking table and this give me gives me the total number of members who have made at least one booking so count will get you the count of non-null values and count distinct will get you the count of unique nonnull values list the facilities with more than 1,000 slots booked so what do we need to do here we need to look at each facility and how many slots they each booked so where is the data for this as you can see again the data is in the bookings table now I don’t need to do any filter so I don’t need the wear statement but I need to count the total slots within each facility so I need a group pi and I can Group by the facility ID and once I do that I can select the facility ID and to get the total slots I can simply do sum of slots and I can call this total slots it’s double quotes for a column name now I need to add the filter I want to keep those that have some of slots bigger than 1,000 and I cannot do it in a where statement right so if I were to write this in a where statement I would get that aggregate functions are not allowed in wear and if I look at my map uh we have been through this again the wear runs first right after we Source the data whereas aggregations happens happen later so the wear cannot be aware of any aggregations that I’ve done for this purpose we actually have the having component so the having component works just like wear it’s a filter it drops rows based on logical conditions the difference is that having runs after the aggregations and it works on the aggregations so I get the data do my first filtering then do the grouping compute an aggregation and then I can filter it again based on the result of the aggregation so I can now now go to my query and take this and put having instead of where and place it after the group pi and we get our result and all we need to do is to order bu facility ID and we get our result find the total revenue of each facility so we want a list of facilities by name along with their total revenue first question as always where is my data so if I want facility’s name it’s in the facilities table but to calculate the revenue I need to know about the bookings so I’ll actually need to join on both of these tables so I will write from CD bookings book join CD facilities fact on facility ID next I will want the total revenue of the facilities but I don’t even have the revenue yet so my first priority should be to compute the revenue let us first select the facility name and here I will now need to add the revenue so to do that I will need to have something like cost times slots and that determines the revenue of each booking however I don’t have a single value for cost I have two values member cost and guest cost and as you remember from previous exercises I need to choose every time which of them to apply and the way that I can choose is by looking at the member ID and if it’s zero then I need to use the guest cost otherwise I need to use the member cost so what can we use now in order to choose between these two variants for each booking we can use the case statement for this so I will say case and then immediately close it with end and I’ll say when uh book M ID equals zero then Fox guest cost I always need to reference the parent Table after a join to avoid confusion else fax member cost so this will allow me to get the C cost dynamically it allows me to choose between two columns and I can multiply this by slots and get the revenue now if I run this I get this result which is the name of the facility and the revenue but I need to ask myself at what level am I working here in other words what does each row represent well I haven’t grouped yet so each row here represents a single booking having joined bookings and facilities and not having grouped anything we are still at the level of this table where every row represent a single booking so to find the total revenue for each facility I now need to do an aggregation I need to group by facility name and then sum all all the revenue I can actually do this within the same query by saying Group by facility name and if I run this I will now get an error can you figure out why I’m getting this error now so I have grouped by facility name and then I’m selecting by facility name and that works well because now this column has been squished has been compressed to show only the unique names for each facility however I am then adding another column which is revenue which I have not compressed in any way therefore this column has a different number of rows than than this column and the general rule of grouping is that after I group by one or more columns I can select by The Columns that are in the grouping and aggregations right so nothing else is allowed so fax name is good because it’s in the grouping revenue is not good because it’s not in the grouping and it’s not an aggregation and to solve this I can simply turn it into an aggregation by doing sum over here and when I run this this actually works and now all I need to do is to sort by Revenue so if I say order by Revenue I will get the result that I need so there’s a few things going on here but I can understand it by looking at my map now what I’m doing is that I’m first sourcing the data and I’m actually joining two tables in order to create a new table where my data is then I’m grouping by a c a column which is the facility name so this compresses the column to all the unique facility name and next I run the aggregation right so the aggregation can be a sum over an existing column but as we saw in the mental models course the aggregation can also be a sum over a calculation I can actually run logic in there it’s very flexible so if I had a revenue column here I would just say sum Revenue as revenue and it would be simpler but I need to do some to put some logic in there and uh this logic involves uh choosing whether to get guest cost or member cost but I’m perfectly able to put that logic inside the sum and so SQL will first evaluate this Logic for each row and then um it will sum up all the results and it will give me Revenue finally after Computing that aggregation I uh select the columns that I need and then I do an order buy at the end find facilities with a total revenue of less than 1,000 so the the question is pretty clear but wait a second we calculate ated the total revenue by facility in the previous exercise so we can probably just adapt that code here’s the code from the previous exercise so check that out if you want to know how I wrote this and if I run this code I do indeed get the total revenue for for each facility and now I just need to keep those with a revenue less than 1,000 so how can I do that it’s a filter right I need to filter on this Revenue column um I cannot use a wear filter because this uh revenue is an aggregation and it was computed after the group buy after the wear so the wear wouldn’t be aware of that uh column but as we have seen there is a keyword there is a statement called having which does the same job as where it filters based on logical conditions however it works on aggregations so I could say having Revenue smaller than 1,000 unfortunately this doesn’t work can you figure out why this doesn’t work in our query we do a grouping and then we compute an aggregation and then we give it a label and then we try to run a having filter on this label if you look now at our map for The Logical order of SQL operations this is where the group by happens this is where we compute our aggregation and this is where having runs and now having is trying to use the Alias that comes at this step but according to our rules having does not know of the Alias that’s assigned at this step because it hasn’t happened yet now as the discussion for this exercise says there are in fact database systems that try to make your life easier by allowing you to use labels in having but that’s not the case with postgress so we need a slightly different solution here note that if I repeated all of my logic in here instead of using the label it would work so if I do this I will get my result I just need to order by Revenue and you see that I get the correct result why does it work when I put the whole logic in there instead of using the label once again the logic happens here and so the having is aware of this logic having happened but the having is just not aware of the Alias however I do not recommend repeating logic like this in your queries because it increases the chances of errors and it also makes them less elegant less readable so the simpler solution we can do here is to take this original query and put it in round brackets and then create a virtual table using a Common Table expression here and call this all of these T1 and then we can treat T1 like any other table so I can say from T1 select everything where revenue is smaller than 1,000 and then order by Revenue remove all this and we get the correct answer to summarize you can use having to filter on the result of aggregation ations unfortunately in postest you cannot use the labels that you assign to aggregations in having so if it’s a really small aggregation like if it’s select some revenue and then all of the rest then it’s fine to say sum Revenue smaller than 1,000 there’s a small repetition but it’s not an issue however if your aggregation is more complex as in this case you don’t really want to repeat it and then your forced to add an extra step to your query which you can do with a common table expression output the facility ID that has the highest number of slots booked so first of all we need to get the number of slots booked by facility and we’ve actually done it before but let’s do it again where is our data the data is in the booking table and uh we don’t need to filter this table but we need we do need to group by the facility ID and then once we do this we can select the facility ID this will isolate all the unique values of this column and within each unique value we can sum the number of slots and call this total slots and if we do this we get the total slots for each facility now to get the top one the quickest solution really would be to order by total slots and then limit the result to one however this would give me the one with the smallest number of slots because order is ascending by default so I need to turn this into descending and here I would get my solution but given that this is a simple solution and it solved our exercise can you imagine a situation in which this query would not achieve what we wanted it to let us say that there were multiple facilities that had the top number of total slots so the top number of slots in our data set is 1404 that’s all good but let’s say that there were two facilities that had this uh this top number and we wanted to see both of them for our business purposes what would happen here is that limit one so the everything else would work correctly and the ordering would work correctly but inevitably in the ordering one of them would get the first spot and the other would get the second spot and limit one is always cutting the output to a single row therefore in this query we would only ever see one facility ID even if there were more that had the same number of top slots so how can we solve this clearly in instead of combining order by and limit we need to figure out a filter we need to filter our table such that only the facilities with the top number of slots are returned but we cannot really get the maximum of some slots in this query because if I tried to do having some slots equals maximum of some slots I would be told that aggregate function calls cannot be nested and if I go back to my map I can see that having can only run after all the aggregations have completed but what we’re trying to do here is to add a new aggregation inside having and that basically doesn’t work so the simplest solution here is to just wrap all of this into a Common Table expression and then get this uh table that we’ve just defined and then select star where the total slots is equal to the maximum number of slots which we know to be 1404 however we cannot hardcode the maximum number of slots because for one we might not know what it is and for and second it uh it will change with time so this won’t work when the data changes so what’s the alternative to hardcoding this we actually need some logic here to get the maximum value and we can put that logic inside the subquery and the subquery will go back to my table T1 and you will actually find the maximum of total slots from T1 so first this query will run it will get the maximum and then the filter will check for that maximum and then I will get uh the required result and this won’t break if there are many facilities that share the same top spot because we’re using a filter all of them will be returned so this is a perfectly good solution for your information you can also solve this with a window function and um which is a sort of row level aggregation that doesn’t change the structure of the data we’ve seen it in detail in the mental models course so what I can do here is to use a window function to get the maximum value over the sum of slots and then I can I will say over to make it clear that this is a window function but I won’t put anything in the window definition because I I just want to look at my whole data set here and I can label this Max slots and if I look at the data here you can see that I will get the maximum for every row and then to get the correct result I can add a simple filter here saying that total slots should be equal to Max slots and I will only want to return facility ID and total slots so this also solves the problem what’s interesting to note here for the sake of understanding window functions more deeply is that the aggregation function for this uh window Clause works over an aggregation as well so here we sum the total slots over each facility and then the window function gets the maximum of all of those uh value and this is quite a powerful feature um and if I look at my map over here I can see that it makes perfect sense because here is where we Group by facility ID and here is where we compute the aggregation and then the window comes later so the window is aware of the aggregation and the window can work on on that so A few different solutions here and overall um a really interesting exercise list the total slots booked per facility per month part two so this is a bit of a complex query but the easiest way to get it is to look at the expected results so what we see here is a facility ID and then within each month of the year 2012 we get the total number of slots and um at the end of it we have a null value here and for facility zero and what we get is the sum of all slots booked in 2012 and then the same pattern repeats repeats with every facility we have the total within each month and then finally we have the total for that facility in the year here so there’s two level of aggregations here and then if I go at the end there’s a third level of aggregation which is the total for all facilities within that year so there are three levels of aggregation here by increasing granularity it’s total over the year then total by facility over the year and then finally total by Facility by month within that year so this is a bit breaking the mold of what SQL usually does in the sense that SQL is not designed to return a single result with multiple levels of aggregation so we will need to be a bit creative around that but let us start now with the lowest level of granularity let’s get this uh this part right facility ID and month and and then we’ll build on top of that so the table that I need is in the bookings table and first question do I need to filter this table yes because I’m only interested in the year 2012 so we have seen that we can use the extract function to get the year out of a Tim stamp which would be start time and we can use this function in a wear filter and what this function will do is that it will go to that time stamp and then we will get an integer out of it it will get a number and then we can check that this is uh the year that we’re interested in and let’s do a quick sanity check to make sure this worked so I will get some bookings here and they will all be in the year 2012 next I need to Define my grouping right so I will need to group by facility ID but then I will also need to group by month however I don’t actually have a column named uh month in this table so I need to calculate it I can calculate it once again with the extract function so I can say extract extract month from start time and once again this will go to the start time and sped out a integer which for this first row would be seven and uh as you know in the group bu I can select a column but I can also select an operation over a column which works just as well now after grouping I cannot do select star anymore but I want to see The Columns that I have grouped by and so let us do a quick sanity check on that it looks pretty good I get the facility ID and the month and I can actually label this month and next I simply need to take the sum over the slots within each facility and within each month and when I look at this I have my first level of granularity and you can see that the first row corresponds to the expected result now I need to add the next level of granularity which is the total within each facility so can you think of how can I add that next level of granularity to my results the key Insight is to look at this uh expected results table and to see it as multiple tables stacked on top of each other one table is the one that we have here and this is uh total by facility month a second table that we will need is the total by facility and then the third table that we will need is the overall total which you could see here at the bottom and how can we stack multiple tables on top of each each other with a union statement right Union will stack all the rows from my tables on top of each other so now let us compute the table which has the total by facility and I will actually copy paste what I have here and and I just need to remove a level of grouping right so if I do this I I will not Group by month anymore and I will not Group by month anymore and once I do this I get an error Union query must have the same number of columns so do you understand this error here so I will write a bit to show you what’s happening so how does it work when we Union two tables let’s say the first table in our case is facility ID month and then slots and then the second table if you look here it’s facility ID and then slots now when you Union these two tables SQL assumes that you have the same number of columns and that the ordering is also identical so here we are failing because the first table has three columns and the second table has only two and not only We are failing because there’s a numbers mismatch but we are also mixing the values of month and Slots now this might work because they’re both integers so SQL won’t necessarily complain about this but it is logically wrong so what we need to do is to make sure that when we’re unioning these two tables we have the same number of columns and the same ordering as well but how can we do this given that the second table does indeed have one column less it does have less information so what I can do is to put null over here so what happens if I do select null this will create a column of a of constant value which is a column of all NS and then the structure will become like this now when I Union first of all I’m going to have the same number of columns so I’m not going to see this uh this error again that we have here and second in u the facility ID is going to be mixed with the facility ID slots is going to be mixed with slots which is all good and then month is going to be mixed with null which is what we want because in some cases we will have the actual month and in some cases we won’t have any anything so I have added uh null over here and I am unioning the tables and if I run the query I can see that I don’t get any error anymore and this is what I want so I can tell that this row is coming from the second table because it has null in the value of month and so it’s showing the total slots for facility um zero in every month whereas this row came from the upper table because it’s showing the sum of slots for a facility within a certain month so this achieves the desired result next we want to compute the last level of granularity which is the total so once again I will select my query over here and and I don’t even need to group by anymore right because it’s the total number of slots over the whole year so I can simply say sum of slots as slots and remove the grouping next I can add the Union as well so that that I can keep stacking these tables and if I run this I get the same error as before so going back to our little uh text over here we are now adding a third table and this table only has slots and of course I cannot this doesn’t work because there’s a mismatch in the number of columns and so the solution here is to also add a null column here and a null column here and so I have the same number of columns and Slots gets combined with slots and everything else gets filled with null values and I can do it here making sure that the ordering is correct so I will select null null and then sum of slots and if I run this query I can see that the result works the final step is to add ordering sorted by ID and month so at the end of all of these unions I can say order by facility ID one and I finally get my result so this is now the combination of three different tables stacked on top of each other that show different levels of granularity and as you can see here in the schema we added null columns to uh two of these tables just to make sure that they have the same number of columns and that they can stack up correctly and now if we look again at the whole query we can see that there are actually three select statements in this query meaning three tables which are calculated and then finally stack with Union and all of them they do some pretty straightforward aggregation the first one um Aggregates by facility ad and month after extracting the month the second one simply Aggregates by facility ID and the third one gets the sum of slots over the whole data without any grouping and then we are adding the null uh constant columns here to make the the column count [Music] match and it’s also worth it to see this in our map of the SQL operations so here um you can see that this order is actually repeating for every table so for each of our three tables we are getting our data and then we are running a filter to keep the year 2012 and then we do a grouping and compute an aggregation and select the columns that we need adding null columns when necessary and then it repeats all over right so for the second table again the same process for the third table the same process except that in the third table we don’t Group by and then when all three tables are done the union r runs the union runs and stacks them all up together and now instead of three tables I only have one table and after the union has run now I can finally order my table and return the result list the total hours booked per named facility so we want to get the facility ID and the facility name and the total hours that they’ve been booked keeping keeping in mind that what we have here are number of slots for each booking and a slot represents 30 minutes of booking now to get my data I will need both the booking table and the facilities table because I need both the information on the bookings and the facility name so I will get the bookings table and the facilities table and join them together next I don’t really need to filter on anything but I need to group by facility so I will Group by facility ID and then I also need to group by facility name otherwise I won’t be able to use this in the select part and now I can select these two columns and to get the total hours I will need to get the sum of the slots so I can get the total number of slots within each facility and I will need to divide this by two right so let’s see what that looks like now superficially this looks correct but there’s actually a pitfall in here and to realize a pitfall I will take some slots as well before dividing it by two and you can see it already in the first row 9911 ided by 2 is not quite 455 so what is happening here the thing is that in postgress when you take an integer number such as some slots the sum of the slots is an integer number and you divide by another integer postgress assumes that you you are doing integer Division and since you are dividing two integers it returns uh an integer as well so that means that um that the solution is not exact if you are thinking in floating Point numbers and the solution for this is that at least one of the two numbers needs to be a Flo floating Point number and so we can turn two into 2.0 and if I run this I now get the correct result so it’s important to be careful with integer division in postest it is a potential Pitfall now what I need to do is to reduce the number of zeros after the comma so I need some sort of rounding and for this I can use the round function which looks like this and this is a typical function in uh in SQL and how it works is that it takes two arguments the first argument is a column and actually this is the column right this whole operation and then the second argument is how many uh figures do you want to see after the zero after the comma sorry so now I can clean this up a bit label this as total hours and then I will need to order by facility ID and I get my result so nothing crazy here really we Source our data from a join which is this part over here and then we Group by two columns we select those columns and U then we sum over the slots divide making sure to not have integer division so we use one of the numbers becomes a floating Point number and we round the result of this column list each Member’s First booking after September 1st 2012 so in order to get our data where does our data leave we need the data about the member and we also need data about their bookings so the data is actually in the members and bookings table so I will quickly join on these [Music] tables and we now have our data do we need a filter on our data yes because we only want to look after September 1st 2012 so we can say where start time is bigger than and it should be enough to just provide the date like this now in the result we need the members surname and first name and their memory ID and then we get to we need to see the first booking in our data meaning the earliest time so again we have an aggregation here so in order to implement this aggregation I need to group by all of these columns that I want to call so surname first name and member ID now that I have grouped by this columns I can select them so now I am I have grouped by each member and now I have all the dates for all their bookings after September 1st 2012 and now how can I look at all these dates and get the earliest date what type of aggregation do I need to use I can use the mean aggregation which will look at all of the dates and then compress them to a single date which is the smallest date and I can call this start time finally I need to order by member ID and I get the result that I needed so this is actually quite straightforward I get my data by joining two tables I make sure I only have the data that I need by filtering on the on the time period and then I group by all the information that I want to see for each member and then within each member I use mean to get the smallest date meaning the earliest date now I wanted to give you a bit of an insight into the subtleties of how SQL Compares timestamps and dates because the results here can be a bit surprising so I wrote three logical Expressions here for you and your job is to try to guess if either of these three Expressions will be true or false so take a look at them and try to answer that as you can see what we have here is a time stamp uh that indicates the 1st of September 8:00 whereas here we have uh simply the indication of the date the 1st of September and the values are the same in all three but my question is are they equal is this uh greater or is this smaller so what do you think I think the intuitive answer is to say that in the first case we have September 1st on one side September 1st on the other they are the same day so this ought to be true whereas here we have again the same day on both sides so this is not strictly bigger than the other one so this should be false and it is also not strictly smaller so this would be false as well now let’s run the query and see what’s actually happening right so what we see here is that we thought this would be true but it’s actually false we thought this would be false but it’s actually uh true and this one is indeed false so are you surprised by this result or is it what you expected if you are surprised can you figure out what’s going on here now what is happening here is that you are running a comparison between two expressions which have a different level of granularity the one on the left is showing you day hour minute seconds and the one on the right is showing you the date only in other words the value on the left is a Tim stamp whereas the value on the right is a date so different levels of precision here now to make the comparison work SQL needs to convert one into the other it needs to do something that is known technically as implicit type coercion what does it mean type is the data type right so either time stamp or date type coercion is when you take a value and you convert it to a different type and it’s implicit uh because we haven’t ask for it and SQL has to do it on its own behind the scenes and so how does SQL choose which one to convert to the other the choice is based on let’s keep the one with the highest precision and convert the other so we have the time stamp with the higher Precision on the left and we need to convert the date into the timestamp this is how SQL is going to handle this situation it’s going to favor the one with the highest Precision now in order to convert a date to a time stamp what SQL will do is that it will add all zeros here so this will basically represent the very first second of the day of uh September 1st 2012 now we can verify which I just showed you I’m going to comment this line and I’m going to add another logical expression here which is taking the Tim stamp representing all zeros here and then setting it equal to the date right here so what do we we expect to happen now we have two different types there will be a type coercion and then SQL will take this value on the right and turn it into exactly this value on the left therefore after I check whether they’re equal I should get true here turns out that this is true but I need to add another step which is to convert this to a Tim stamp and after I do this I get what I expected which is that this comparison here is true so what this notation does in postest is that it does the type coercion taking this date and forcing it into a time stamp and I’ll be honest with you I don’t understand exactly why I need to to do this here I thought that this would work simply by taking this part over here but u i I also need to somehow explicitly tell SQL that I want this to be a time stamp nonetheless this is the Insight that we needed here and it allows us to understand why this comparison is actually false because we are comparing a time stamp for the very first second of September 1st with a time stamp that is the first second of the eighth hour of September 1st and so it fails and we can also see why on on this line the left side is bigger than the right hand side and uh and this one did not actually fool us so we’re good with that so long story short if you’re just getting started you might not know that SQL does this uh implicit type coercion in the background and this dates comparison might leave you quite confused now I’ve cleaned the code up a bit and now the question is what do we need to do with the code in order to match our initial intuition so what do we need to do such that this line is true and the second line is false and this one is still false so we don’t have to worry about it well since the implicit coercion turns the date into a time stamp we actually want to do the opposite we want to turn the time stamp into a date so it will be enough to do the type coion ourselves and transform this into dates like this and when I run this new query I get exactly what I expected so now I’m comparing at the level of precision or granularity that I wanted I’m only looking at the at the date so I hope this wasn’t too confusing I hope it was a bit insightful and that you have a new appreciation for the complexities that can arise when you work with dates and time stamps in SQL produce a list of member names with each row containing the total member count let’s look at the expected results we have the first name and the surname for each member and then every single row shows the total count of members there are 31 members in our table now if I want to get the total count of members I can take the members table and then select the count and this will give me 31 right but I cannot add first name and surname to this I will get uh an error because count star is an aggregation and it takes all the 31 rows and produces a single number which is 31 while I’m not aggregating first name and surname so the standard aggregation doesn’t work here I need an aggregation that doesn’t change the structure of my table and that works at the level of the row and to have an aggregation that works at the level of the row I can use a window function and the window function looks like having an aggregation followed by the keyword over and then the definition of the window so if I do this I get the count at the level of the row and to respect the results I need to change the order a bit here and I get the result that I wanted so a window function has these two main components an aggregation and a window definition in this case the aggregation counts the number of rows and the window definition is empty meaning that our window is the entire table and so this aggregation will be computed over the entire table and then added to each row there are far more details about the window functions and how they work in my mental model course produce a numbered list of members ordered by their date of joining so I will take the members table and I will select the first name and surname and to to produce a numbered list I can use a window function with the row number aggregation so I’ll say row number over so row number is a special aggregation that works only for window functions and what it does is that it numbers the rows um monotonically giving a number to each starting from one and going uh forward and it never assigns the same number to two rows and in the window you need to define the ordering uh for for the numbering so what is the ordering in this case it’s um defined by the join date and by default it’s ascending so that’s good and we can call this row number and we get the results we wanted and again you can find a longer explanation for this with much more detail about the window functions and and row number in the mental models course output the facility ID that has the highest number of slots booked again so we’ve we’ve already solved this problem in a few different ways let’s see a new way to to solve it so we can go to our bookings table and we can Group by facility ID and then we can get the facility ID in our select and then we could sum on slots to get the total slots booked for each facility and since we’re dealing with window functions we can also rank facilities based on the total slots that they have booked and this would look like rank over order by some slots descending and we can call this RK for Rank and if I order by some slots uh descending I should see that my rank works as intended so we’ve seen this in the mental models course you can think of rank as U deciding the outcome of a Race So the person who did the most in this case gets ranked one and then everyone else gets rank two 3 four but if there were two um candidates that got the same score the highest score they would both get rank one because they would both have won the race so to speak and the rank here is defined over the window of the sum of slots descending so that is what we need and next to get all the facilities that have the highest score or we could wrap this into a Common Table expression and then take that table and then select the facility ID and we can label this column total then we will get total and filter for where ranking is equal to one and we get our result aside from how rank works the the other thing to note in this exercise is that we can Define the window based on an aggregation so in this case we are ordering the elements of our window based on the sum of slots and if we look at our map over here we can see that uh we get the data we have our group ey we have the aggregation and then we have the window so the window follows the aggregation and So based on our rules the window has access to the aggregation and it’s able to use it rank members by rounded hours used so the expected results are quite straightforward we have the first name and the surname of each member we have the total hours that they have used and then we are ranking them based on that so the information for this result where is it uh we can see that it’s in the members and bookings tables and so we will need to join on these two tables members Ms join bookings book on M ID and that’s our join now we need to get the total hours so we can Group by our first name and we also need to group by the surname because we will want to display it and now we can select these two columns and we need to compute the total hours so how can we get that for each member we know the slots that they got uh at every booking so we need to get all those those uh slots sum them up and uh every slot represents a 30 minute interval right so to get the hours we need to divide this value by two and remember if I take an integer like sum of slots and divide by two which is also an integer I’m going to have integer division so I won’t have the part after the comma in the result of the division and that’s not what I want so instead of saying divide by two I will say divide by 2.0 so let’s check um how the data looks like this is looking good now but um if we read the question we want to round to the nearest 10 hours so 19 should probably be 20 115 should probably be 120 because I think that we round up when we have 15 and so on as you can see here in the result so how can we do this rounding well we have a Nifty round function which as the first argument takes the column with all the values and the second argument we can specify how do we want the rounding and to round to the nearest 10 you can put -1 here so actually let’s keep displaying the the total hours as well as the rounded value to make sure that we’re doing it correctly so as you can see we are indeed um rounding to to the nearest 10 so this is looking good and for the to understand the reason why I used minus one here and how the rounding function works I will have a small section about it when we’re done with this exercise but meanwhile Let’s uh finish this exercise so now I want to rank all of my rows based on this value here that I have comped computed and since this is an aggregation it will already be available to a window function right because in The Logical order of operations aggregation happen here and then Windows happen afterward and they have access to the data uh from the aggregation so it should be possible to transform this into a window function so think for a moment uh of how we could do that so window function has its own aggregation which in this case is a simple Rank and then we have the over part which defines the window and what do we want to put in our window in this case we want to order by let’s say our um rounded hours and we want to order descending because we want the guest the member with the high hours to have the best rank but uh clearly we don’t have a column called rounded hours what we have here is this logic over here so I will substitute this name with my actual logic and I will get my actual Rank and now I can delete this column here that I was was just looking at and I can sort by rank surname first name small error here I actually do need to show the hour as well so I need to take this logic over here again and call this ours and I finally get my result so to summarize what we are doing in this exercise we’re getting our data by joining these two tables and then we’re grouping by the first name and the surname of the member and then we are summing over the slots for each member dividing by 2.0 to make sure we have an exact Division and uh using the rounding function to round down to the nearest hour and so we get the hours and we use the same logic inside a window function to have a ranking such that the members with the with most hours get rank of one and then the one with the second most hours get rank of two and so on as you can see here in the result and I am perfectly able to use use this logic to Define The Ordering of my window because window functions can use uh aggregations as seen in The Logical order of SQL operations here because window functions occur after aggregations and um and that’s it then we just order by the required values and get our results now here’s a brief overview of how rounding Works in SQL now rounding is a function that takes a certain number and then returns an approximation of that number which is usually easier to parse and easier to read and you have the round function and it works like this the first argument is a value and it can be a constant as in this case so we just have a number or it can be a column um in which case it will apply the round function to every element of the column and the second argument specifies how we want the rounding to occur so here you can see the number from which we start and the first rounding we apply has an argument of two so this means that we really just want to see two uh numbers after the decimal so this is what the first rounding does as you can see here and we we round down or up based on whether the values are equal or greater than five in which case we round up or smaller than five in which case we round down so in this first example two is lesser than five so we just get rid of it and then we have eight eight is greater than five so we have to round up and so when we round up this 79 becomes an 80 and this is how we get to this first round over here here then we have round with an argument of one which leaves one place after the decimal and which is this result over here and then we have round without any argument which is actually the same as providing an argument of zero which means that we really just want to see the whole number and then what’s interesting to note is that the rounding function can be generalized to continue even after we got rid of all the decimal part by providing negative arguments so round with the argument of-1 really means that I want to round uh round this number to the nearest 10 so you can see here that from 48,2 192 we end up at 48,2 190 going to the nearest 10 rounding with a value of -2 means going to the nearest 100 so uh 290 the nearest 100 is 300 right so we have to round up and so we get this minus 3 means uh round to the nearest thousand so if you look at here we have 48,3 and so the nearest thousand to that is 48,000 minus 4 means the nearest 10,000 ,000 so given that we have 48,000 the nearest 10,000 is 50,000 and finally round minus 5 means round to the nearest 100,000 and um the given that we have 48,000 the nearest 100,000 is actually zero and from now on as we keep going negatively we will always get zero on this number so this is how rounding Works in brief it’s a pretty useful function not everyone knows that you can provide it negative arguments actually I didn’t know and then when I did the first version of this course um commenter pointed it out so shout out to him U don’t know if he wants me to say his name but hopefully now you understand how rounding works and you can use it in your problems find the top three Revenue generating facilities so we want a list of the facilities that have the top three revenues including ties this is important and if you look at the expected results we simply have a the facility name and a bit of a giveaway of what we will need to use the rank of these facilities so there’s this other exercise that we did a while back which is find the total revenue of each facility and from this exercise I have taken the code that uh allows us to get to this point where we see the name of the facility and the total revenue for that facility and you can go back there to that exercise to see in detail how this code works but in brief we are joining the bookings and Facilities tables and we are grouping by facility name and then we are getting that facility name and then within each booking we are Computing the revenue by taking the slots and using a case when to choose whether to use guest cost or member cost and so this is how we get the revenue for each single booking and now given that we grouped by facility we can sum all of these revenues to get the total revenue of each facility and this is how we get to this point given this partial result all that’s left to do now is to rank these facilities based on their revenue so what I need here is a window function that will allow me to implement this ranking and this window function would look something like this I have a rank and why is rank the right function even though they sort of uh gave it away because if you want the facilities who have the top revenues including ties you can think of it as a race all facilities are racing to get to the top revenue and then if two or three or four facilities get that top Revenue if there are more in the top position you can’t arbitrarily say oh you are first and they are second second you have to give them all the rank one because you have to tell them um recognize that they are all first so these type of problems uh call for a ranking solution so our window function would use rank as the aggregation and then we need to Define our window and how do we Define our window we Define the ordering for the ranking here so we can say order by Revenue descending such that the high highest revenue will get rank one the next highest will get rank two and so on now this will not work because I don’t have the revenue column right I do have something here that is labeled as Revenue but the ranking part will not be aware of this label however I do have the logic to compute the revenue so I could take the logic right here and paste it over here and I will add a comma now this is not the most elegant looking code but let’s see if it works and we need to order by Revenue descending to see it in action and if I order by Revenue descending you can in fact see that the facility with the highest revenue gets rank one and then it goes down from there so now I just need to clean this up a bit first I will remove the revenue column and then I will remove the ordering and what I need here for the result is to keep only the facilities that have rank of three or smaller so ranks 1 2 three and there’s actually no way to do it in this query so I actually have to wrap this query into a common table expr expression and then take that table and say select star from T1 where rank is smaller or equal to three and I will need to order by rank ascending here and I get the result I needed so what happened here we built upon the logic of getting the total revenue for each facility and again we saw that in the previous exercise and um then what we did here is that we added a rank window function and within this rank we order by this total revenue so this might look a bit complex but you have to remember that when we have many operations that are nested you always start with the innermost operation and move your way up from there so the innermost operation is a case when which chooses between guest cost and member cost and then multiplies it by slots and this inner operation over here is calculating the revenue for each single booking the next operation is an aggregation that takes that revenue for each single booking and sums this these revenues up to get the total revenue by each facility and finally the outermost operation is taking the total revenue for each facility and it’s ordering them in descending order in order to figure out the ranking and the reason all of this works we can go back to our map of SQL operations you can see here that after getting the table the first thing that happens here is the group buy and then the aggregations and here is where we sum over the total of of Revenue and after the aggregation is completed we have the window function so the window function has access to the aggregation and can use them when defining the window and finally after we get the ranking we we have no way of isolating only the first three ranks in this query so we need to do it with a common table expression and if you look here back to our map this makes sense because what components do we have in order to filter our table in order to only keep certain rows we have the wear which happens here very early and we have the having and they both happen before the window so after the window function you actually don’t have another filter so you need to use a Common Table expression classify facilities by value so we want to classify facilities into equally sized groups of high average and low based on their revenue and the result you can see it here for each facility it’s classified as high average or low and the point is that we decid decided uh at the beginning that we want three groups and this is arbitrary we could have said we want two groups or five or six or seven and then but we have three and then all the facilities that we have are distributed equally Within These groups so because we have nine facilities we get uh three facilities within each group and I can already tell you that there is a spe special function that will do this for us so we will not go through the trouble of implementing this manually which could be pretty complex so I have copied here the code that allow allows me to get the total revenue for each facility and we have seen this code more than one time in past exercises so if you’re still not clear about how we can get to this point uh check out the the previous exercises so what we did in the previous exercise was rank the facilities based on the revenue and how we did that is that we took the ranking window function and then we def defined our window as order by Revenue descending except that we don’t have a revenue column here but we do have the logic to compute the revenue so we can just get this logic and paste it in here and when I run this I will get a rank for each of my facilities where the biggest Revenue gets rank one and then it goes up from there now the whole trick to solve this exercise is to replace the rank aggregation with a antile aggregation and provide here the number of groups in which we want to divide our facilities and if I run this you see that I get what I need the facilities have been equally distributed into three groups where group number one has the facilities with the highest revenue and then we have group number two and finally group number three which has the facilities with the lowest revenue and to see how this function works I will simply go to Google and say postest antile and the second link here is the postest documentation and this is the page for window functions so if I scroll down here I can see all of the functions that I can use in window functions and you will recognize some of our old friends here row number rank dance rank uh and here we have antile and what we see here is that antile returns an integer ranging from one to the argument value and the argument value is what we have here which is the number of buckets dividing the partition as equally as possible so we call the enti function and we provide how many buckets we want to divide our data into and then the function divides the data as equally as possible into our buckets and how will this division take place that depends on the definition of the window in this case we are ordering by Revenue descending and so this is how the ntile function works so we just need to clean this up a bit I will remove the revenue part because that’s not required from us and I will call this uh enti quite simply and now I need to add a label on top of this enti value as you can see in the results so to do that I will wrap this into a Common Table expression and when I have a common table expression I don’t need the ordering anymore and then I can select from the table that I have just defined and what what do I want to get from this table I want to get the name of the facility and then I want to get the enti value with a label on top of it so I will use a case when statement to assign this label so case when NTI equals 1 then I will have high when anti equals 2 then I will have average else I will have low uh and the case and call this revenue and finally I want to order by antile so the results are first showing High then average then low and also by facility name and I get the result that I wanted so to summarize uh this is just like the previous exercise except that we use a different window function because instead of rank we use end tile so that we can pocket our data and in the window like we said in the previous exercise there’s a few nested operations and you can figure it out by going to the deepest one and moving upwards so the first one picks up the guest cost or member cost multiplies it by slots gets the revenue Vue for each single booking the next one Aggregates on top of this within each facility so we get the total revenue by facility and then we use this we order by Revenue descending this defines our window and this is what the bucketing system uses to distribute the facilities uh in each bucket based on their revenue and then finally we need to add another layer of logic uh here we need to use a common table expression so that we can label our our percentile with the required um text labels calculate the payback time for each facility so this requires some understanding of the business reality that this data represents so if we look at the facilities table we have an initial outlay which represents the initial investment that was put into getting this facility and then we also have a value of monthly maintenance which is what we pay each month to keep this facility running and of course we will also have a value of monthly revenue for each facility so how can we calculate the amount of time that each facility will take to repay its cost of ownership let’s actually write it down so we don’t lose track of it we can get the monthly revenue of each facility but what we’re actually interested in is the monthly profit right um and to get the profit we can subtract the monthly maintenance for each facility so Revenue minus expenses equals profit and when we know how much profit we make for the facility each month we can take the initial investment and divided by the monthly profit and then we can see how many months it will take to repay the initial investment so let us do that now and what I have done here once again I copied the code to calculate the total revenue for each facility and um we have seen this in the previous exercises so you can check those out if you still have some questions about this and now that we have the total revenue for each facility we know that we have three complete months of data so far so how do we get to this to the monthly Revenue it’s as simple as dividing all of this by three and I will say 3.0 so we don’t have integer division but we have proper division you know and I can call this monthly revenue and now the revenue column does not exist anymore so I can remove the order buy and here I can see the monthly revenue for each facility and now from the monthly revenue for each facility I can subtract the monthly maintenance and this will give me the monthly profit but now we get this error and can you figure out what this is about monthly maintenance does not appear in the group by Clause so what we did here is that we grouped by facility name and then we selected that which is fine and all the rest was gation so remember as a rule when you Group by you can only select the columns that you have grouped by and aggregations and monthly maintenance uh is not an aggregation so in order to make it work we need to add it to the group by statement over here and now I get the monthly profit and finally the last step that I need to take is to take the initial outlay and divide it by by all of the rest that we have computed until now and we can call this months because this will give us the number of months that we need in order to repay our initial investment and again we get the same issue initial outlay is not an aggregation does not appear in the group by clause and easy solution we can just add it to the group by clause so something is pretty wrong here the values look pretty weird so looking at all this calculation that we have done until now can you figure out why the value is wrong the issue here is related to the order of operations because we have no round brackets here the order of operation will be the following initial outlay will be divided by the total revenue then it will be divided by 3.0 and then out of all of these we will subtract monthly maintenance but that’s not what we want to do right what we want to do is to take initial outlay and divide it by everything else which is the profit so I will add round brackets here and here and now we get something that makes much more sense because first we execute everything that’s Within These round brackets and we get the monthly profit and then all of it we divide initial outlay by and then what we want to do is to order by facility name so I will add it here and we get the result so quite a representative business problem calculating a revenue and profits and time to repay initial investment and uh overall is just a bunch of calculations starting from the group bu that allows us to get the total revenue for each booking we sum those revenues to get the total revenue for each facility divide by three to get the monthly Revenue subtract the monthly expenses to get the monthly profit and then take the initial investment and divide by the monthly profit and then we get the number of months that it will take to repay the facility calculate a rolling average of total revenue so for each day in August 2012 we want to see a rolling average of total revenue over the previous 15 days rolling averages are quite common in business analytics and how it works is that if you look at August 1st this value over here is the average of daily revenue for all facilities over the past 15 days including the day of August 1st and then this average is rolling by one win one day or sliding by one day every time so that the next average is the uh same one except it has shifted by one day because now it includes the 2nd of August so let’s see how to calculate this and in here I have basic code that calculates the revenue for each booking and I’ve taken this from previous exercises so if you have any questions uh check those out and what we have here is the name of each facility and um and the revenue for each booking so each row here represents just a single booking so this is what we had until now but if you think about it we’re not actually interested in seeing the name of the facility because we’re going to be uh summing up over all facilities we’re not interested in the revenue by each facility but we are interested in seeing the date in which each booking occurs because we want to aggregate within the date here so to get the date I can get the start part time field from bookings and because this is a time stamp so it shows hours minutes seconds I need to reduce it to a date and what I get here is that for again each row is a booking and for each booking I know the date on which it occurred and the revenue that it generated now for the next step I need to see the total revenue over each facility within the date right so this is a simple grouping so if I group by this calculation over here which gives me my date I can then get the date and now I have um I have compressed all the different occurrences of dates to Unique values right one row for every date and now I need to compress as well all these different revenues for each date to a single value and for that I can put this logic inside the sum aggregation as we have done before and this will give me the total revenue across all facilities for each day and we have it here for the next step my question for you is how can I see the global average over all revenues on each of these rows so that is a roow level aggregation that doesn’t change the structure of the table and that’s a window function right so I can have a window function here that gets the average of Revenue over and for now I can leave my window definition open because I will look at the whole table however um Revenue will not work because revenue is just a label that I’ve given on this column and but but this part here is not aware of the label I don’t actually have a revenue column at this point but instead of saying Revenue I could actually copy this logic over here and it would work because the window function occurs after Computing the aggregation so the window function is aware of it so this should work and now for every row I see the global average over all the revenues by day now for the next step I would like to first order by date ascending so we have it here in order and my next question of for you is how can we make this a cumulative average average so let’s say that our rows are already ordered by date and how can I get the average to grow by date so in the first case the average would be equal to the revenue because we only have one value on the second day the average would be the average of these two values so all the values we’ve seen until now on the third day it would be the average of the first three values and so on how can I do that the way that I can do that is that I can go to my window definition over here and I can add an ordering and I can order by date but of course the column date does not exist because that’s a label that will be assigned after all this part is done uh window function is not aware of labels but again window function works great with logic so I will take the logic and put it in here and now you can see that I get exactly what I wanted on the first row I get the average is equal to the revenue and then as it grows we only look at the current revenue and all the previous revenues to compute the average and but we don’t look at all of the revenues so on the second row uh we have the average between this Revenue over here and this one over here and then on the third row we have the average between these three revenues and so on now you will realize that we are almost done with our problem and the only piece that’s missing is that right now if I pick a random day within my data set say this one the the average here is computed over all the revenues from the previous days so all the days in my data that lead up to this one they get averaged and we compute this revenue and what I want to do to finish this problem is that instead of looking at all the days I only want to look 15 days back so I need to to reduce the maximum length that this window can extend in time from limited to 15 days back now here is where it gets interesting so what we need to do is to fine-tune the window definition in order to only look 15 days back and with window functions we do have the option to fine-tune the window and it turns out that there’s a another element to the window definition which is usually implicit it’s usually not written explicitly but it’s there in the background and it’s the rows part so I will now write rows between unbounded preceding and current rows row now what the rose part does is that it defines how far back the window can look and how far forward the the window can look and what we see in this command is actually the standard Behavior it’s the thing that happens by default which is why we usually don’t need to write it and what this means is that it says look as far back in the past as you can look as far back as you can based on the ordering and the current row so this is what we’ve been seeing until now and if I now run the query again after adding this part you will see that the values don’t change at all because this is what we have been doing until now so now instead of unbounded proceeding I want to look 14 rows back plus the current row which together makes 15 and if I run this my averages change because I’m now looking um I’m now averaging over the current row and the 14 previous rows so the last 15 values and now what’s left to do to match our result is to remove the actual Revenue over here and call this Revenue and finally we’re only interested in values for the month of August 2012 so we need to add a filter but we cannot add a filter in this table definition here because if we added a wear filter here um isolating the period for August 2012 can you see what the problem would be um if my data could only see um Revenue starting from the 1st of August he wouldn’t be able to compute the rolling average here because to get the rolling average for this value you need to look two weeks back and so you need to look into July so you need all the data to compute the rolling revenue and we must filter after getting our result so what that looks like is that we can wrap all of this into a Common Table expression and we can we won’t need the order within the Common Table expression anymore and then selecting this we can filter to make sure that the date fits in the required period so we could truncate this date at the month level and make sure that it is equal that the truncated value value is equal to the month of August and we have seen how day trunk works in the previous exercises and then we could select all of our columns and order by date I believe we may have an extra small error here because I kept the partial wear statement and if I run this I finally get the result that I wanted so a query that was a bit more complex it was the final boss of our exercises um so let’s summarize it we get the data we need by joining booking and facility um and then we are getting the revenue for each booking that is this um multiply slots by either guest cost or member cost cost depending on whether the member is a guest or not this is getting the revenue within each booking then we are grouping by date which you see uh over here and summing all of these revenues that we computed so that we get the total revenue within each day for all facilities then the total revenue for each day goes into a window function which computes an aggre ation at the level of each row and the window function computes the average for these total revenues within a specific window and the window is defines an ordering based on time so the the ordering based on date and the default behavior of the window would be to look at the average for the current day and all the days that precede up until the earliest date and we’re doing here is that we are fine-tuning the behavior of this function by saying hey don’t look all the way back in the past uh only look at 14 rows preceding plus the current row which means that given the time ordering we compute the average over the last 15 values of total revenue and then finally we wrap this in a Common Table expression and we filter so that we only see the rolling average for the month of August and we order by date and that were all the exercises that I wanted to do with you I hope you enjoyed it I hope you learned something new as you know there are more sections in here that go more into depth into date functions and string functions and how you can modify data I really think you can tackle those on your own these were the uh Essentials ones that I wanted to address and once again thank you to the author of this website aliser Owens who created this and made it available for free I did not create this website um so you can just go here and without signing up or paying anything you can just do these exercises my final advice for you don’t be afraid of repetition we live in the age of endless content so there’s always something new to do but there’s a lot of value to um repeating the same exercises over and over again when I Was preparing for interviews when I began as a date engineer I did these exercises and altogether I did them like maybe three or four times um and um I found that it was really helpful to do the same exercises over and over again because often I did not remember the solution and I had to think through it all over again and it strengthened those those uh those learning patterns for me so now that you’ve gone through all the exercises and seen my Solutions uh let it rest for a bit and then come back here and try to do them again I think it will be really beneficial in my course I start from the very Basics and I show you in depth how each of the SQL components work I um explore the logical order of of SQL operations and I spend a lot of time in Google Sheets um simulating SQL operations in the spreadsheet coloring cells moving them around making some drawings in excal draw uh so that I can help you understand in depth what’s happening and build those mental models for how SQL operations work this course was actually intended as a complement to that so be sure to check it out

    By Amjad Izhar
    Contact: amjad.izhar@gmail.com
    https://amjadizhar.blog

  • Trump’s Presidency: Rhetoric, Reality, and Global Impact by Rohan Khanna India

    Trump’s Presidency: Rhetoric, Reality, and Global Impact by Rohan Khanna India

    The source critiques Donald Trump’s political rhetoric and actions, particularly his stance on Islamic terrorism and his travel ban. It argues that Trump’s policies alienate moderate Muslims and are counterproductive. The author suggests Trump’s approach is similar to that of inexperienced politicians, prioritizing short-term interests over long-term stability. The text also points to the role of extremist organizations in shaping negative perceptions of Islam. Ultimately, the author expresses hope that the American system, including the judiciary, will constrain Trump’s more divisive policies. The piece warns that his administration’s actions risk alienating allies and repeating past mistakes.

    Navigating Politics and Perception: A Study Guide

    Quiz:

    1. According to the author, how is the word “politics” generally perceived in their society and media?
    2. What qualities, according to the author, should a politician possess to effectively lead a nation in modern times?
    3. What comparison does the author draw between Donald Trump and Pakistani politicians?
    4. What was President Trump’s initial announcement regarding “Islamic Terrorism,” and what was the author’s reaction to it?
    5. What was President Trump’s order to ban citizens of seven Islamic countries from entering America, and what were the consequences of this decision?
    6. According to the author, what group is made happy because of the ban on citizens of seven Islamic countries entering America?
    7. According to the author, who is the culprit that is draining a large section of people in the West away from Muslims?
    8. What is the author’s opinion of extremist organizations that link every inhuman incident with Islam?
    9. What is the author’s opinion about people “who cover their veils?”
    10. How does the author view the American judiciary’s role in checking President Trump’s executive orders?

    Quiz Answer Key:

    1. The author believes that their society and media generally present the word “politics” as being synonymous with cleverness, cunningness, and even deception, rather than the art of governance or advancing a nation with understanding and intelligence.
    2. According to the author, a politician should possess qualities of subtlety, understand the psychology of their people in accordance with modern demands, and have the consciousness to take them forward, rather than being thick-minded or superficial.
    3. The author compares Donald Trump and Pakistani politicians based on their perceived lack of experience, mental and conscious imbalance, and tendency to make temporary or self-interested decisions, rather than those of a permanent or national nature.
    4. President Trump announced that he would support “Islamic Terrorism” and delete the page from the entity; the author responded by stating that Muslims were not hurt by this announcement, and that terrorism is not the agenda of any religion.
    5. President Trump ordered a ban on citizens from seven Islamic countries from entering America; this order upset liberal Muslims while Violent Muslims with negative thinking were happy with this order; and led to large-scale protests in America and Europe.
    6. The author believes Violent Muslims with negative thinking are made happy because of the ban on citizens of seven Islamic countries entering America.
    7. The author believes that the culprit that is draining a large section of people in the West away from Muslims is “our own foreigners” that are responsible organizations that connect every inhuman incident with Islam.
    8. The author does not approve of extremist organizations that link every inhuman incident with Islam such as ISIS, Taliban, Hamas, Bukohram, Al-Shabab and Jamaat-ul-Islamia.
    9. The author refers to them as “stupid friends of Islam and the Muslims.”
    10. The author sees the American judiciary as playing a crucial role in checking President Trump’s power by declaring some of his executive orders unconstitutional, suggesting a healthy system of checks and balances within the American government.

    Essay Questions:

    1. Analyze the author’s critique of the modern perception of “politics” and discuss the potential consequences of viewing politics as merely “cleverness and cunningness.”
    2. Evaluate the author’s comparison between Donald Trump and Pakistani politicians. Do you find the comparison valid? Why or why not? Support your argument with specific examples.
    3. Discuss the author’s perspective on the relationship between the West and the Muslim world, focusing on the idea that “our own foreigners” are partly responsible for the growing divide.
    4. Assess the author’s view on the role of the American judiciary in checking the power of the executive branch, particularly in the context of President Trump’s administration.
    5. Explore the broader themes of identity, representation, and global relations within the text. How does the author navigate these complex issues in their analysis of President Trump and international politics?

    Glossary of Key Terms:

    • Politics: The art or science of governance; the activities associated with governing a country or area, especially the debate or conflict among individuals or parties hoping to achieve power. (As defined within the text, the term has a more elevated sense of advancing a nation with understanding and intelligence.)
    • Rhetoric: The art of effective or persuasive speaking or writing, especially the use of figures of speech and other compositional techniques.
    • Executive Order: A rule or order issued by the President of the United States to an executive branch of the government and having the force of law.
    • Darul-War: An Islamic term referring to a territory or country where Islamic law does not prevail.
    • Islamic Terrorism: Terrorism committed by groups or individuals who profess Islamic motivations or goals.
    • Liberal Muslims: Muslims who embrace more open-minded interpretations of Islamic texts and values, typically favoring tolerance and progressiveness.
    • Propaganda: Information, especially of a biased or misleading nature, used to promote or publicize a particular political cause or point of view.
    • Modern Western Civilization: The norms, values, traditions, and practices that are part of Western culture, and have evolved over time.
    • Judiciary: The judicial authorities of a country; the branch of government that interprets and applies the law in the name of the state.
    • Checks and Balances: A system that allows each branch of a government to amend or veto acts of another branch so as to prevent any one branch from exerting too much power.

    Critique of Trump: Rhetoric, Islam, and International Relations

    Briefing Document: Analysis of “Pasted Text” Regarding Donald Trump

    Date: October 26, 2023 (Assumed based on request) Subject: Analysis of an opinion piece criticizing Donald Trump’s political approach, rhetoric, and impact, particularly on the perception of Islam and international relations. Sources: Excerpts from “Pasted Text”

    Executive Summary:

    This document analyzes an opinion piece strongly critical of Donald Trump, focusing on its core arguments regarding his perceived lack of political acumen, inflammatory rhetoric concerning Islam, and detrimental impact on international relations. The author paints Trump as an immature and interest-driven leader whose policies and statements have alienated allies and exacerbated existing tensions. The text also discusses the perception of politics as cunning and deception, contributing to the rise of inexperienced leaders like Trump. It further argues that extremist Islamic groups contribute to the negative perception of Islam, indirectly enabling figures like Trump.

    Main Themes and Key Arguments:

    1. Trump’s Inexperience and Lack of Political Subtlety: The author believes Trump lacks the intelligence, consciousness, and understanding of psychology required for effective governance. They compare him to “clowns or claimants of national leadership” who are “mentally and consciously…unbalanced” and incapable of making sound, long-term decisions. The author suggests his entrepreneurial, interest-driven mindset prevents him from seeing beyond immediate gains.
    • “Ahead of the recent US elections, we used the acronym of the popular Indian film “Three Edits” when criticizing the presidential candidate Donald Trump and wanted to say in a lighter manner that clowns or claimants of national leadership who do not have much experience in this field. Mentally and consciously they are unbalanced. Unfortunately, when they get leadership, they cannot make better decisions of a permanent nature for their nation because their entrepreneurial and interest thinking fails to see beyond the general emergency and temporary interests.”
    1. Criticism of Trump’s Rhetoric Regarding Islam: The author criticizes Trump’s pronouncements regarding “Islamic Terrorism” and the travel ban on citizens from several Muslim-majority countries. The piece argues these actions alienated moderate Muslims and emboldened extremists, ultimately serving to divide rather than unite.
    • “For example, when he took his first presidential oath, he said that he is supporting “Islamic Terrorism.” Will delete the page from the entity. Apparently it was a charming announcement or slogan, but such slogan could not be expected from a thoughtful politician…Then they took something more demonstrative, i.e. ordering to ban citizens of seven Islamic countries from coming to America. We wrote on it that with this idiotic order, they have upset the average liberal Muslims while Violent Muslims with negative thinking are happy with this order “Darul-War”.”
    1. The Role of Extremist Groups in Shaping Perceptions of Islam: The author argues that actions of extremist groups like ISIS, the Taliban, and others contribute to the negative perception of Islam, thereby indirectly enabling leaders like Trump to gain support through divisive rhetoric.
    • “If you analyze it with integrity, the culprit is not the West, but our own foreigners. There are responsible organizations that connect their every inhuman incident with Islam. In this regard, there is no use in naming extremist organizations such as ISIS, Taliban, Hamas, Bukohram, Al-Shabab and Jamaat-ul-Islamia etc.”
    1. Impact on International Relations and Alliances: The author suggests Trump’s policies and pronouncements are damaging US relationships with key allies, particularly in Europe and Saudi Arabia. The text points to Vice President’s harsh language in Munich as an example.
    • “If today, your historical ally like Saudi Arabia is saying yes to your illegitimate yes, then here is the background. To be understood right now the whole of Europe is upset with the language your vice president has used in Munich regarding European allies if you guys continue your irresponsible upbringing like this what will you make new allies many old ones too Will lose.”
    1. Politics as Cunning Deception: The author laments the degradation of the term “politics,” associating it with trickery and deception rather than the art of governance. This negative perception contributes to the appeal of outsiders and inexperienced leaders.
    • “Our society and our media presents this word in the sense of cleverness and cunningness. Linguistically though it is the art of governance or symbols where as the founder may mean “politics” to advance a nation or people of the nation with understanding and intelligence.”

    Important Ideas and Facts:

    • The author draws a parallel between Trump and “clumsy” Pakistani politicians, implying a similar lack of competence and understanding.
    • The author acknowledges the US judiciary’s role in checking Trump’s power by declaring some of his executive orders unconstitutional.
    • The author believes that Trump should study his own history in order to better understand the geopolitical landscape he was navigating.
    • The article highlights how anti-immigrant sentiment in Europe and America are impacting legal and illegal immigration. Conclusion:

    This opinion piece presents a scathing critique of Donald Trump’s political approach, particularly focusing on its negative impact on international relations, the perception of Islam, and its emphasis on cleverness and cunning. The author portrays Trump as an inexperienced and divisive figure whose rhetoric and policies have alienated allies, emboldened extremists, and contributed to a global environment of increased tension and misunderstanding. The text also underscores the importance of internal moderation and introspection within the Muslim community to combat extremist narratives and prevent the negative perception of Islam.

    Trump, Politics, and Global Perceptions of Islam

    Here is an 8-question FAQ based on the provided text:

    1. What is the author’s critique of Donald Trump and his approach to politics?

    The author critiques Trump for his rhetoric, lack of experience, and perceived mental imbalance. They argue that his policies and statements, such as the initial travel ban on citizens from seven Islamic countries and his focus on “Islamic terrorism,” alienate moderate Muslims and empower extremist groups. The author sees Trump’s approach as driven by short-term interests rather than long-term strategic thinking, comparing him unfavorably to thoughtful politicians.

    2. How does the author view the term “politics” as it is commonly understood and practiced?

    The author believes that “politics” is often presented in a negative light, associated with cleverness, cunningness, and deception rather than the art of governance. They argue that true politics should be about advancing a nation with understanding, intelligence, and consideration for the people’s well-being, requiring subtle qualities rather than thick-mindedness.

    3. What is the author’s opinion on Trump’s statement about “Islamic Terrorism?”

    The author finds Trump’s initial focus on “Islamic Terrorism” to be a thoughtless slogan that could not be expected from a thoughtful politician. While acknowledging that some Muslims might not be hurt by it, they emphasize that terrorism should not be associated with any particular religion. The author suggests that concrete actions, rather than announcements, are needed to address the issue.

    4. How does the author analyze the reactions to Trump’s travel ban?

    The author notes that Trump’s travel ban upset liberal Muslims while potentially pleasing violent Muslims with negative thinking. They question who Trump is serving by implementing such policies. The author also observes that the protests against the ban were more significant in America and Europe than in Muslim countries themselves.

    5. What role do “stupid friends of Islam and the Muslims” play in the global perception of Islam, according to the author?

    The author argues that certain groups, such as ISIS, the Taliban, and other extremist organizations, contribute to negative perceptions of Islam by associating every inhuman incident with the religion. They are referred to as “stupid friends of Islam and the Muslims” because their actions provide ammunition for those who seek to demonize the religion.

    6. How does the author explain Trump’s rise to power in the context of these issues?

    The author suggests that the intensity in the ranks, caused by the negative actions and rhetoric associated with certain extremist groups and their “idiot friends,” helps explain the rise of leaders like Trump and Modi. These leaders benefit from the fear and anxiety generated by these issues.

    7. What is the author’s view of the American political system’s ability to check Trump’s power?

    The author expresses admiration for the American system, particularly the judiciary, for its ability to check Trump’s power by declaring some of his executive orders unconstitutional. They expect that the realities of the world will force Trump to compromise and learn from past mistakes, referencing President Bush Jr.’s approach to Iran.

    8. What is the author’s concern regarding Trump’s relationship with allies?

    The author is concerned about Trump’s approach to foreign relations, noting that Europe is upset with his Vice President’s language in Munich regarding European allies. They suggest that his irresponsible behavior could lead to the loss of old allies and difficulties in forming new ones, particularly if he continues to ignore historical lessons.

    Donald Trump: Policies, Reactions, and Global Implications

    Here’s a discussion of Donald Trump, based on the provided sources:

    • Before the US elections, Donald Trump was criticized using the acronym of the Indian film “Three Edits,” suggesting that he and other national leadership claimants lacked experience and were mentally unbalanced. The source suggests that such leaders may make poor, temporary decisions due to their entrepreneurial and self-interest thinking.
    • The source mentions that after winning the election, Donald Trump made statements that echoed those of his European allies, described as “fall their own”. The author uses the phrase “Masha Allah, when there are such internal ‘friends’ there is no need for external enemies” to describe this.
    • According to the source, since taking office, President Trump has made controversial statements, such as claiming he would eliminate “Islamic Terrorism”. The author suggests that such slogans are not expected from a thoughtful politician and that concrete actions, rather than announcements, are more effective.
    • One demonstrative action mentioned was the ban on citizens from seven Islamic countries from entering America. The source indicates that this order upset liberal Muslims and pleased violent Muslims with negative thinking, raising the question of whom Trump was serving. The ban led to protests in America and Europe.
    • Despite the above, the judiciary of the American system has checked some of Trump’s executive orders by declaring them unconstitutional. The author expresses the hope that “bitter ground realities will force Trump to compromise”.
    • The author also suggests Trump should study his own recent history and understand the implications of alienating allies, as Europe is upset with his vice president’s language in Munich. The author goes on to assert that if such “irresponsible upbringing” continues, he may lose old allies and fail to make new ones.

    American Politics: Rhetoric, Leadership, and Governance

    Here’s a discussion of American politics, based on the provided sources:

    • The sources suggest that American politics, particularly during Donald Trump’s presidency, has been characterized by controversial rhetoric and policies.
    • The author expresses concern over the state of politics, where propaganda is used to manipulate the common people, presenting politics as a negative thing. According to the source, this is described not just as trickery but as deception. The author questions what power is involved in spreading this propaganda.
    • American political leaders are described as sometimes lacking experience and being mentally unbalanced, which can lead to poor decision-making.
    • The American judiciary has acted as a check on the executive branch, declaring some of President Trump’s executive orders unconstitutional.
    • The source suggests that American politicians should learn from their own history and avoid alienating allies. The author cautions against the potential consequences of “irresponsible upbringing” in politics, which could lead to the loss of old allies and the failure to gain new ones.
    • The source contrasts the traditional understanding of “politics” as the art of governance aimed at advancing a nation with understanding and intelligence, against a modern perception of politics as mere cleverness and cunningness. According to the source, superficial and inexperienced individuals are sometimes favored over experienced and worldly politicians, to the detriment of the nation.

    Islamic Terrorism: Origins, Impact, and Perceptions

    Here’s a discussion of Islamic Terrorism, based on the provided sources:

    • The source mentions that President Trump stated he would eliminate “Islamic Terrorism”. The author suggests that terrorism cannot be the agenda of any religion. Instead of such announcements, the author suggests that concrete steps should be taken silently to address the issue.
    • The source mentions specific extremist organizations such as ISIS, Taliban, Hamas, Bukohram, Al-Shabab, and Jamaat-ul-Islamia. The author asserts that these organizations connect their inhuman acts to Islam. The author goes on to say that these groups are “stupid friends of Islam and the Muslims” and that their actions contribute to negative perceptions.
    • The source suggests that the intensity of these groups and the actions of their “idiot friends and allies” is a reason why individuals like Trump or Modi have found success in politics.
    • The source claims that some Muslims with violent or negative thinking were happy with Trump’s order to ban citizens from seven Islamic countries from entering America, viewing it as “Darul-War”.

    Western Civilization: Humanity, Relationships, and Alliances

    Here’s a discussion of Western Civilization, based on the provided sources:

    • According to the source, modern Western civilization is based on humanity, despite various stumbling and bitter experiments.
    • The source suggests that a large section of people in the West are drained from the Muslims. The author claims the culprit is not the West, but rather “our own foreigners,” referring to organizations that connect inhuman incidents with Islam. These organizations contribute to a negative perception, influencing Western views.
    • The source mentions that Europe is upset with the language used by the U.S. Vice President in Munich regarding European allies, suggesting potential strains in relationships within the West.
    • The author warns against alienating allies and suggests that irresponsible behavior could lead to the loss of old alliances and failure to form new ones.

    By Amjad Izhar
    Contact: amjad.izhar@gmail.com
    https://amjadizhar.blog

  • Excel VBA: Mastering Macros, Procedures, and Variable Usage

    Excel VBA: Mastering Macros, Procedures, and Variable Usage

    The provided text offers a comprehensive guide to using Visual Basic for Applications (VBA) within Microsoft Excel. It covers a wide range of topics, from recording and editing macros to creating custom functions and user forms. Key concepts explored include variable declaration, data types, control structures like loops and conditional statements, and object-oriented programming principles. The text provides practical examples and step-by-step instructions to automate tasks and enhance Excel’s functionality. Debugging techniques and strategies for error handling are also discussed. The ultimate goal is to equip readers with the skills to create sophisticated Excel-based applications.

    VBA Macro Programming: Study Guide and Reference

    VBA Macro Study Guide

    Quiz

    1. What is the purpose of commenting your code in VBA? Comments are used to describe the code’s functionality and intent, making it easier to understand and maintain. They also help in recalling the code’s purpose after a period of time.
    2. How do you rename a module in the VBA editor? In the Project Explorer window, select the module. Then, in the Properties window, change the “Name” property of the module to the desired name.
    3. How can you access a macro stored in another open workbook? You can access the macro via the View tab (Macros -> View Macros) or the Developer tab. Make sure “All Open Workbooks” is selected in the “Macros in” dropdown.
    4. Explain the difference between a Property and a Method in VBA. A Property is a characteristic or attribute of an object (e.g., name, color). A Method is an action that can be performed on an object (e.g., clear contents, activate).
    5. What is the purpose of the “Option Explicit” statement? “Option Explicit” forces explicit variable declaration. This means all variables must be declared before they can be used, preventing errors caused by misspelled or undeclared variables.
    6. Explain what “scope” means in the context of procedures. Scope determines where a procedure can be called or used. Procedures can be public, private, or undeclared; undeclared defaults to public.
    7. Describe the purpose of the Immediate Window in the VBA editor. The Immediate Window is used to test code snippets, display the values of variables, and execute commands directly during development and debugging. You can execute or print by either typing “print” or a question mark.
    8. What is a user-defined function (UDF) in Excel VBA? A user-defined function is a custom function created in VBA that can be used in Excel worksheets just like built-in functions, performing calculations and returning values.
    9. What does the term “debugging” mean in the context of coding? Debugging is the process of identifying, tracing, and correcting errors (bugs) in code to ensure the program runs correctly and produces the expected results.
    10. Explain the purpose of a “breakpoint” in VBA debugging. A breakpoint is a marker inserted into the code that causes the program execution to pause at that line. This allows the developer to examine the state of the program, inspect variables, and step through the code line by line to identify errors.

    Quiz Answer Key

    1. Comments are used to describe the code’s functionality and intent, making it easier to understand and maintain. They also help in recalling the code’s purpose after a period of time.
    2. In the Project Explorer window, select the module. Then, in the Properties window, change the “Name” property of the module to the desired name.
    3. You can access the macro via the View tab (Macros -> View Macros) or the Developer tab. Make sure “All Open Workbooks” is selected in the “Macros in” dropdown.
    4. A Property is a characteristic or attribute of an object (e.g., name, color). A Method is an action that can be performed on an object (e.g., clear contents, activate).
    5. “Option Explicit” forces explicit variable declaration. This means all variables must be declared before they can be used, preventing errors caused by misspelled or undeclared variables.
    6. Scope determines where a procedure can be called or used. Procedures can be public, private, or undeclared; undeclared defaults to public.
    7. The Immediate Window is used to test code snippets, display the values of variables, and execute commands directly during development and debugging. You can execute or print by either typing “print” or a question mark.
    8. A user-defined function is a custom function created in VBA that can be used in Excel worksheets just like built-in functions, performing calculations and returning values.
    9. Debugging is the process of identifying, tracing, and correcting errors (bugs) in code to ensure the program runs correctly and produces the expected results.
    10. A breakpoint is a marker inserted into the code that causes the program execution to pause at that line. This allows the developer to examine the state of the program, inspect variables, and step through the code line by line to identify errors.

    Essay Questions

    1. Discuss the advantages and disadvantages of recording macros versus writing VBA code from scratch. In what situations would recording a macro be preferable, and when is it better to write the code directly?
    2. Explain the different levels of variable scope in VBA (Procedure, Module, and Public). Describe how each scope affects the accessibility and lifetime of a variable, providing examples of scenarios where each scope would be most appropriate.
    3. Compare and contrast the different types of looping constructs in VBA, specifically Do While/Until loops and For/Next loops. Explain their use cases, advantages, and limitations, providing examples of when you might choose one type of loop over another.
    4. Describe the purpose of error handling in VBA. Explain the different error trapping options, discuss how to implement error handling using the On Error GoTo statement, and provide a detailed example of an error handling routine.
    5. Explain how the Select Case statement and the IF/THEN/ELSE/END IF structures achieve the same purpose. Discuss the scenarios in which one might be more suitable than the other.

    Glossary of Key Terms

    • Argument: A value passed to a procedure when it is called.
    • Breakpoint: A marker in code that pauses execution for debugging.
    • Calling Procedure: A procedure that invokes another procedure.
    • Called Procedure: A procedure invoked by another procedure.
    • Code: Instructions written in a programming language.
    • Collection: A group of related objects.
    • Comment: Explanatory text in code that is ignored by the interpreter.
    • Compile: To translate source code into machine-executable code.
    • Constant: A named storage location that contains data that cannot be changed during program execution.
    • Data Type: The classification of a particular type of information (e.g., Integer, String, Boolean).
    • Debugging: Identifying and fixing errors in code.
    • Declaration: Specifying the name and type of a variable or procedure.
    • Explicit Declaration: Declaring variables before use (using Dim, Private, Public, or Static).
    • Implicit Declaration: Using a variable without declaring it (generally discouraged).
    • Function Procedure: A procedure that performs a calculation and returns a value.
    • Immediate Window: A VBA window for executing code directly and displaying values.
    • Intrinsic Function: A built-in function provided by VBA.
    • Loop: A programming construct that repeats a block of code.
    • Macro: A series of commands and instructions that are grouped together as a single command to accomplish a task automatically.
    • Method: An action that can be performed on an object.
    • Module: A container for VBA code (procedures, declarations).
    • Object: An entity in VBA that has properties and methods.
    • Object Browser: A VBA tool for exploring available objects, properties, and methods.
    • Parameter: A variable passed to a function or subprocedure.
    • Procedure: A named block of code that performs a specific task (either a Sub or a Function).
    • Project Explorer: A window in the VBA editor that displays the project’s files.
    • Property: A characteristic or attribute of an object.
    • Public: A scope that makes a variable or procedure accessible from any module.
    • Private: A scope that restricts a variable or procedure to the module in which it is declared.
    • Run Time: The period during which a program is executing.
    • Scope: The region of a program where a variable or procedure is accessible.
    • Statement: A complete instruction in a programming language.
    • Sub Procedure: A procedure that performs a task but does not return a value directly.
    • Syntax: The rules governing the structure of a programming language.
    • Variable: A named storage location that can hold data that can be changed during program execution.
    • With…End With: A VBA construct that simplifies code by allowing multiple operations on a single object without repeatedly referencing the object.

    VBA Macro Recording and Editing Fundamentals

    Okay, here’s a briefing document summarizing the key themes and ideas from the provided text excerpts:

    Briefing Document: VBA Macro Recording and Editing

    Overview:

    The provided text is a transcript from a course or tutorial on VBA macro recording and editing within Microsoft Excel. It covers various aspects of working with macros, from recording and cleaning up code to understanding procedures, scope, error handling, and using the Visual Basic Editor (VBE). The text emphasizes practical, hands-on learning, with numerous examples and step-by-step instructions.

    Key Themes and Ideas:

    1. Macro Recording as a Starting Point: The text highlights the value of recording macros as a way to generate VBA code quickly. It suggests recording, then modifying the generated code. “We’re going to record a macro again to get this lesson started, and along the way… whether we’re recording macros or we’re writing VBA code from scratch, we’re also going to be using properties and we’re going to be using methods.”
    2. Importance of Code Comments: The document stresses the significance of commenting code liberally for clarity and maintainability. “ments are meant to describe your code it’s a good idea to comment your code liberally i’ve written code before and didn’t comment it and six months later i had to figure out what the intent of the code that i wrote was so comments are really good.” The comments generated from the macro recorder serve as a basic form of documentation.
    3. Understanding VBA Code Structure: The text explains the anatomy of VBA code, including modules, sub procedures, function procedures, and the With…End With construct. It illustrates how recorded actions translate into specific VBA commands (e.g., Rows(“1:1”).Select, Selection.Insert).
    4. Procedures: Sub vs. Function: The document differentiates between sub procedures (which perform actions) and function procedures (which perform calculations and return values). It explains how function procedures can be used as User Defined Functions (UDFs) in Excel worksheets. “a function procedure performs a calculation and returns a single value or an array of values so differs from a sub procedure.”
    5. Module Management: The transcript stresses the organization of VBA code through modules and the importance of giving modules descriptive names. A prefix “mod” is suggested to identify modules in a list. “You want your module names to be as descriptive as possible… we don’t want them to be module one module two module three module four so we’re gonna use the properties window to make some changes to properties so we’re going to start with renaming module 1… we’re going to use lowercase mod mod to indicate that it is a module.”
    6. Properties and Methods: The course material makes the distinction between properties and methods: “properties to change the name of a module we use properties to change the name of this particular sheet tab and a method is an action that is taken on an object so you’ll learn how to access methods along the way as well.”
    7. Scope of Procedures: The importance of understanding procedure scope (Public, Private, Undeclared/Public) is discussed. Scope determines where a procedure can be called from. “Scope determines where the procedure may be used…If a procedure declaration is preceded by the keyword public this makes the procedure accessible to all modules in the visual basic project…If the procedure declaration is preceded by the keyword private this makes the procedure available only in the module where it resides.”
    8. Variable Declaration and Data Types: The text emphasizes the importance of explicit variable declaration and assigning appropriate data types. Implicit declaration can lead to errors. Various data types are mentioned (Byte, Boolean, Integer, Long, Single, Double, Currency, Date, String, Variant). The Option Explicit statement is key to enforcing explicit declaration.
    9. Intrinsic Functions (String Manipulation): The document introduces built-in VBA functions like Left, Mid, and Right for manipulating strings. It demonstrates how to extract specific characters or substrings from a larger text string (like a VIN number).
    10. Conditional Logic (If…Then…Else, Select Case): The transcript covers conditional branching using If…Then…Else constructs and the Select Case statement. These are used to execute different blocks of code based on specific conditions. These control structures are analogous to the IF function in Excel.
    11. Looping Constructs (Do While/Until, For…Next, For Each): The document introduces looping constructs for repeating code blocks. It covers Do While and Do Until loops, as well as For…Next loops for a specific number of iterations and For Each loops for iterating through collections (e.g., worksheets).
    12. Object Variables and the Set Keyword: The course material explains the use of object variables, which hold references to objects (e.g., worksheets, ranges). The Set keyword is essential when assigning objects to variables.
    13. With…End With Construct: The With…End With block is presented as a way to simplify code by avoiding repetitive object references.
    14. The Offset Property: This property is discussed as a means to easily reference cells relative to a starting cell using rows and columns offsets.
    15. User Interaction (MsgBox, InputBox): The transcript shows how to use MsgBox (message box) functions to display information to the user and InputBox functions to prompt the user for input.
    16. Event Procedures: Event procedures are introduced as a way to trigger code execution based on specific events (e.g., worksheet activation). The example given shows how to run a macro when a specific sheet is activated. “as soon as we activated that sheet it ran our get new inventory calling procedure.”
    17. Error Handling: The text provides an overview of error handling in VBA, covering the types of errors (logic, runtime, syntax). It introduces the On Error GoTo statement for trapping errors and creating error handling routines. “We’re going to get into trapping errors with the on error statement which includes understanding the error object writing an error handling routine and working with inline error handling.”
    18. Debugging Tools: The transcript refers to using debugging tools in the VBE, such as breakpoints, stepping through code (Step Into, Step Over, Step Out), the Immediate Window, Locals Window, and Watch Window.
    19. The Object Browser: This tool is described as a way to explore available objects, their properties, methods, and events, as well as to get online help. “The object browser allows you to browse through all available objects in your project and see their properties methods and events.”

    Quotes Highlighting Key Concepts:

    • “Apply a counting format to columns we’re going to make that plural columns g and then and h and when you move away from that line it will turn green again indicating that it’s a comment.” (Illustrates commenting and how the VBE recognizes comments.)
    • “Clear contents is a method of the range object it would empty the cells delete everything that’s in the cells in the range add is a method of the workbook’s collection object and it’s used to create a new workbook and then you have activate and that’s a method of the worksheet object it’s used to activate a worksheet” (Illustrates the use of methods on objects)
    • “the scope of a variable determines not only where it can be used but the circumstances in which the variable is removed from memory.” (Highlights the importance of variable scope.)
    • “We need to tell it what values to assign to each variable and now we’ve told it where to display those variable values which column and cell to display it in by using our offset statements within the with end width structure.” (Highlights the importance of assigning values and specifying where to display)

    Overall Impression:

    The excerpts provide a solid foundation for learning VBA macro recording and editing. The practical examples, step-by-step instructions, and emphasis on code organization and error handling make it a valuable resource for beginners and intermediate users alike. The course’s emphasis on troubleshooting and debugging is especially valuable.

    VBA Macro Programming: Recording, Modification, and Usage

    Macro Recording, Modification, and VBA Basics

    1. What are the benefits of commenting code in VBA, and how are comments created when recording a macro?

    Comments are crucial for code maintainability and understanding. They explain the purpose and intent of specific code sections, making it easier to revisit and modify the code later, especially after a significant time has passed. When recording a macro, the descriptions entered in the “Record Macro” dialog box are automatically inserted as comments in the generated VBA code.

    2. What is a “With…End With” block in VBA, and what purpose does it serve?

    A “With…End With” block is a construct in VBA that allows you to perform multiple operations on a single object without repeatedly specifying the object name. It improves code readability and reduces redundancy. For instance, when modifying multiple formatting properties of a cell, you can use a “With Selection” block to apply changes to Selection.Font.Bold, Selection.Alignment, etc., without rewriting “Selection” each time.

    3. How can you rename a module in the VBA editor, and why is it important to do so?

    To rename a module in the VBA editor, select the module in the Project Explorer window, then go to the Properties window (usually found below the Project Explorer). Double-click the “Name” property and enter a descriptive name for the module. Renaming modules helps organize your code into logical sections, especially when a project contains multiple modules. Using a prefix like “mod” is helpful for quickly identifying modules in a list.

    4. How can you access a macro stored in one Excel file from another Excel file?

    To access a macro stored in one Excel file (e.g., vehicles.xlsm) from another, the file containing the macro (vehicles.xlsm) must be open. You can then access the macro by going to the “View” tab, clicking “Macros,” and selecting “View Macros.” In the Macros dialog box, you can choose the macro from the open file. The macro will be listed as [filename]![macroname].

    5. What are properties and methods in VBA, and can you provide examples?

    In VBA, properties are attributes or characteristics of an object, while methods are actions that can be performed on an object.

    • Properties: Examples include changing the name of a module or a sheet tab, and you can do this using the properties window.
    • Methods: Examples include Range(“A1:B11”).ClearContents (clears the contents of cells), Workbooks.Add (creates a new workbook), and Worksheets(“Sheet1”).Activate (activates a specific worksheet).

    6. What is the difference between a Sub procedure and a Function procedure in VBA?

    • Sub Procedure: A block of code that performs a series of actions. It does not return a value. Sub procedures are commonly used to automate tasks or manipulate data.
    • Function Procedure: A block of code that performs a calculation and returns a single value or an array of values. Function procedures can be used in VBA code or directly in Excel worksheets as user-defined functions (UDFs).

    7. What is the “Immediate Window” in the VBA editor, and how can it be used for testing Function procedures?

    The Immediate Window in the VBA editor allows you to execute VBA code directly and view the results immediately. To test a Function procedure, you can type a question mark (?) followed by the function name and its arguments (e.g., ?MSPRStatus(10000)) and press Enter. The result returned by the function will be displayed in the Immediate Window, allowing you to quickly verify its correctness. The print command functions the same as the question mark.

    8. Explain the difference between implicit and explicit variable declaration in VBA, and why is explicit declaration preferred?

    • Implicit Declaration: Occurs when you use a variable without first declaring it using a Dim statement. VBA automatically creates the variable, but its data type may not be what you intend, potentially leading to errors.
    • Explicit Declaration: Involves declaring each variable with a Dim statement, specifying its name and data type. This is the preferred method because it forces you to define the variable’s purpose and helps prevent errors due to typos or unintended data type conversions. To enforce explicit variable declaration, you can set the “Require Variable Declaration” option in the VBA editor’s options. This will automatically insert Option Explicit at the top of every module, forcing you to declare each variable before using it.

    VBA Programming in Microsoft Office Applications

    VBA (Visual Basic for Applications) is a Microsoft programming language integrated into Office applications like Excel, Word, PowerPoint, Outlook, and Access. It allows users to automate repetitive tasks and extend the capabilities of these applications.

    Key aspects of VBA programming include:

    • Object-Oriented Programming (OOP): VBA is an object-oriented language where everything in an application is an object with its own features (properties) and actions (methods). For instance, in Excel, the application itself, cells, worksheets, charts, and shapes are all objects.
    • Automating Tasks: VBA enables automating recurring tasks, creating user-defined functions, and controlling other Office applications. It can attach code to events, allowing it to run automatically when an event occurs (e.g., activating a worksheet).
    • VBA vs. Macros: While Excel macros are powerful, VBA offers advantages like attaching code to events, decision-making capabilities, looping structures, and the ability to create user input forms and dialog boxes. Macros have limitations because you are restricted to tasks that you can perform in the Excel interface.
    • Excel Object Model: VBA uses a hierarchical structure of Excel and its objects. The application resides at the top, followed by objects like workbooks, worksheets, and ranges. VBA accesses these objects by moving down the hierarchy using the dot operator.
    • Collections: These are groups of objects of the same type, such as all open workbooks (the Workbooks collection) or all worksheets in a workbook (the Worksheets collection). VBA code can loop through members of a collection to perform actions on each one.
    • Modules and Procedures: VBA code is stored in modules. Sub procedures define specific tasks, while function procedures return a value. Procedures have naming rules and conventions.
    • Variables: Variables store data in the computer’s memory during procedure execution. They have naming rules, scope (where they can be used), and data types (e.g., Integer, String, Boolean). Explicit declaration of variables is preferred to avoid errors.
    • Language Elements: VBA has language elements like variables, data types, and intrinsic functions. Intrinsic functions are built-in functions that perform specific tasks.
    • Control of Flow Structures: VBA uses control of flow structures to make decisions in code. These include conditional branching (If Then Else, Select Case) and looping constructs (Do While, For Next).
    • User Forms: VBA allows the creation of user forms with controls (text boxes, check boxes, etc.) for user input. Code can be applied to these controls to perform specific actions.
    • Debugging: VBA includes debugging tools to identify and correct code errors. The Visual Basic Editor has a debug toolbar for stepping through code, setting breakpoints, and inspecting variable values. There are three types of errors: logic errors, runtime errors and compile errors.
    • Error Handling: VBA provides error trapping options using the On Error statement to handle runtime errors.
    • Object Browser: The object browser allows browsing through all available objects in a project and see their properties, methods, and events.
    • Code Protection: VBA code can be password protected to prevent unauthorized access.

    Excel Macros and VBA: Automation Guide

    Macros in Microsoft Excel are a way to automate repetitive and recurring tasks. While macros and VBA (Visual Basic for Applications) both contribute to automation, VBA offers more advanced capabilities.

    Here’s a comparison of Excel macros and VBA:

    • CapabilitiesMacros are limited to tasks that can be performed within the Excel interface.
    • VBA allows for more complex operations, such as attaching code to specific events (like activating a worksheet), decision-making processes, looping structures, and creating custom user input forms.
    • LimitationsWhen recording macros, users are restricted to actions achievable through the Excel interface.
    • VBA removes these limitations, offering greater flexibility and control over Excel and other Office applications.
    • Code Access and ModificationVBA enables users to write and modify code, including the code behind recorded macros.
    • Users can access the Visual Basic Editor (VBE) to view and edit the VBA code associated with macros.
    • Saving Files with MacrosWorkbooks containing macros must be saved in a macro-enabled format (.xlsm) to preserve the VBA code.
    • Failure to save in this format will result in the loss of the code.
    • SecurityExcel has security measures that, by default, disable macros upon opening a macro-enabled file.
    • This is indicated by a yellow band with a security warning.
    • Users can enable content from trusted sources.
    • Trusted locations can be set up to avoid security warnings for files from known and secure sources.
    • Creating MacrosMacros can be created by recording actions within Excel or by writing VBA code directly.
    • The developer tab in Excel provides tools for recording, viewing, running, and editing macros. If the developer tab isn’t visible, it can be enabled in the Excel options.
    • Macros can be initiated from the “View” tab or by using the shortcut Alt + F8.
    • Running MacrosMacros can be run using a button in the developer tab or using Alt+F8.
    • Macros stored in one file can be used in another if the file containing the macro is open.

    Visual Basic Editor (VBE) in Microsoft Office: A Guide

    The Visual Basic Editor (VBE) is the environment used to write, edit, and manage VBA code in Microsoft Office applications. Here’s a breakdown of its key aspects, based on the sources:

    • Accessing the VBE: The VBE can be accessed from the Developer tab in Excel by clicking the “Visual Basic” button. A shortcut key, Alt + F11, can also switch between Excel and the VBE.
    • Environment Overview:
    • The VBE opens in a separate window from Excel.
    • It has a menu bar with options like File, Edit, View, Insert, and Tools.
    • Toolbars provide quick access to frequently used commands.
    • Key Components:
    • Project Explorer: Located in the upper left corner, it displays all open projects (files) and their components (modules, sheets, forms).
    • Code Window: This is where VBA code is written and edited. To view a code window, click on a module in the Project Explorer.
    • Properties Window: Displays the properties of selected objects (e.g., modules, forms, controls). Properties can be modified to change the appearance and behavior of objects.
    • Immediate Window: Accessed via the View menu, this window is used to test function procedures and execute single lines of code. For example, ? msrpStatus(10000) will print the result of the msrpStatus function with the argument 10000. The question mark is the same as print in VBA.
    • Modules: Containers that store VBA code. There are different types of modules:
    • Standard modules
    • Class modules
    • UserForm modules – each form has a built-in class module that contains code related to the form and its controls
    • Customization:
    • Options: The Tools > Options menu allows customization of the VBE.
    • The Editor tab includes code settings, such as “Require Variable Declaration,” which forces explicit variable declaration.
    • The Editor Format tab allows changing the font size and style of the code window.
    • Toolbar: VBA commands, like comment block, uncomment block, and compile project can be added to the toolbar. Right-click on the toolbar and select “Customize” to add commands. The compile project icon checks the code for errors.
    • Debugging Tools: The VBE includes a debug toolbar to investigate errors.
    • Breakpoints: Breakpoints can be inserted to pause code execution at a specific line.
    • Step Into: Executes code one line at a time.
    • Locals Window: Shows the current value of variables.
    • Quick Watch: Displays the value of a selected expression.
    • Object Browser: The object browser (View > Object Browser, or F2) allows browsing through all available objects in a project and see their properties, methods, and events.
    • Help: Context-sensitive help is available by pressing F1 when a keyword is selected. This opens the Microsoft documentation for VBA.
    • Code Protection: VBA code can be password-protected via Tools > VBAProject Properties > Protection tab.

    VBA Procedures, Functions, Modules: A Developer’s Guide

    Procedures and functions are fundamental building blocks of VBA (Visual Basic for Applications) code, serving to organize and execute specific tasks.

    Here’s a breakdown of procedures and functions in VBA:

    • ProceduresA procedure is a named group of statements that execute as a unit to perform a specific task.
    • A sub procedure defines specific tasks, such as inserting a new row or adding column headers.
    • Sub Procedures:
    • Begin with a Sub statement and end with an End Sub statement.
    • Can be executed in several ways, such as through a macro dialog box, by calling it from another procedure, by attaching it to a button in the quick access toolbar in Excel, or by attaching the procedure to an event.
    • Event Procedures:
    • Respond to specific events within the application.
    • To create an event procedure, you must access an object’s events.
    • Typically, the names of event procedures should not be changed.
    • Property Procedures:
    • Allow a programmer to create and manipulate custom properties.
    • Outside the scope of the training course in the sources.
    • Calling Procedures:
    • A sub procedure can act as a calling procedure by bundling multiple other procedures together.
    • A calling procedure calls other procedures to execute them in a specific order.
    • FunctionsFunction procedures perform a calculation and return a value or an array of values.
    • Begin with a Function statement and end with an End Function statement.
    • Can be called from a sub procedure or another function procedure, or used in a worksheet formula.
    • When created in VBA, a function procedure can only be executed in two ways:
    • By calling the procedure from a sub procedure or another function procedure.
    • By using the function in a worksheet formula, where it becomes a user-defined function.
    • Can be tested using the Immediate Window in the Visual Basic Editor.
    • ModulesModules act as containers that store VBA code.
    • There are two main types of modules:
    • Standard Modules: Used for storing standard code.
    • Class Modules: Used for creating one’s own objects.
    • Naming Rules and ConventionsProcedure names can be up to 255 characters long.
    • They can be alphanumeric, but the first character must be a letter.
    • Spaces and special characters are not allowed.
    • Procedure names must be unique within a module.
    • Conventions include starting names with a verb and using proper case for each word.
    • Scope of ProceduresDetermines where a procedure can be used.
    • Public: Accessible to all modules in the VBA project.
    • Private: Accessible only within the module where it resides.
    • Undeclared: If a procedure’s scope is undeclared, it defaults to public.
    • Executing ProceduresProcedures can be executed or run in different ways within VBA:
    • Using the macro dialog box.
    • Using the run sub user form button on the VBE toolbar.
    • Calling the procedure from another sub procedure.
    • Adding a button to the quick access toolbar in Excel.
    • Attaching the procedure to an event.
    • Running it from the immediate window in Visual Basic Editor.

    VBA Object Variables: Declaration, Assignment, Scope, and Benefits

    Object variables in VBA are used to make code more concise and avoid lengthy object references. Instead of repeatedly typing out the full reference to an object, you can assign the object to a variable and then use the variable name to refer to the object.

    Here’s what you need to know about object variables in VBA:

    • Declaration:
    • Object variables are declared using the Dim, Public, or Private keywords, just like regular variables. The Static keyword can also be used.
    • Instead of a data type (like Integer or String), you declare the variable with an object type, such as Worksheet or Range.
    • Example: Dim mySheet As Worksheet
    • Assignment:
    • To assign an object to an object variable, you must use the Set keyword.
    • Example: Set mySheet = Worksheets(“Sheet1”)
    • After this assignment, you can use the variable mySheet to refer to the “Sheet1” worksheet.
    • Scope:
    • The scope of object variables is determined by where they are declared (module-level or procedure-level) and the keyword used (Dim, Public, Private).
    • Dim or Private: The variable is available only within the module or procedure where it’s declared.
    • Public: The variable is available to all procedures in all modules.
    • Benefits:
    • Conciseness: Object variables shorten code by replacing long object references with a simple variable name.
    • Readability: They can make code easier to read and understand.
    • Efficiency: Although not explicitly stated in the sources, using object variables can improve performance by reducing the need to repeatedly resolve object references.
    • Example (Based on the sources):
    • This example is based on information in the sources and demonstrates the use of object variables to sum the selling price in a column and place the total two rows below the last populated cell:
    • Sub AddTotals()
    • Dim lastCell As Range ‘ Declares object variables
    • Dim totalFormula As String ‘ Declares object variables
    • Set lastCell = Range(“I2”).End(xlDown) ‘ Sets lastCell to the last populated cell in column I
    • lastCell.Select ‘ Selects the last cell
    • ActiveCell.Offset(2, 0).Select ‘ Offset moves the active cell 2 rows down
    • totalFormula = “=SUM(I2:I” & lastCell.Row & “)” ‘ Formula for total
    • ActiveCell.Formula = totalFormula ‘ Enters the formula in the offset cell
    • End Sub
    Excel 2019 VBA Full Course Tutorial (7+ Hours)

    The Original Text

    hi everyone i’m trish connor cato welcome to the excel 2019 visual basic for applications video course this course is for beginning users looking to automate repetitive and recurring tasks in microsoft excel vba is microsoft’s programming language and it’s built into the office applications our focus during this course is on excel specifically you’ll be equipped with the basics to start writing your own vba code modify the code behind macros you’ve already recorded and have an understanding of how vba lends itself to creating efficiency in your daily tasks we’ll start with the basics where you’ll learn the types of things you can do with vba versus recording macros in excel as well as some key terminology which will help in your vba journey and you will get to edit vba code you’ll learn the importance of macro enabled workbooks and how to save them as well as how to modify some security settings we’ll move on to understanding the excel object model collections and how to reference objects in vba code once these basics are covered you’ll be ready to move on learning about the different types of procedures creating procedures learning the scope of procedures and working with methods you’ll also learn how to get vba context-specific help from within the visual basic editor if you’re enjoying these videos please like and subscribe if you want to earn certificates and digital badges please become a member of our patreon the link is in our video description if you have any questions you want answered by one of our instructors please join our off-site community the link is in the description as well as always if this course has exercise files you’ll find them in the video description below in our first lesson getting started you’re going to be learning about an overview of vba that includes what type of language it is why you would want to use visual basic for applications versus recording macros and advantages that it can give you in terms of efficiency we’ll move into recording a macro and running it in excel and then we’ll go into the visual basic editor environment and you’ll get an overview of the environment before we start editing a macro in vba you’ll learn how to save a macro enabled workbook and the importance of doing so you’ll learn a little bit about macro security now in this lesson we’re going to be using two files that are in the video description there both excel files one is named vehicles and the other one vehicles two we will be creating a vehicle’s macro enabled workbook during this lesson and the name of that workbook is shown on the slide you will not find it in the video description at this time so what you would want to do is grab those two excel files vehicles and vehicles too from the video description and put them somewhere on your system where you have easy access to them before we get hands-on let’s go ahead and get an overview of vba so as mentioned in the introductions vba is a microsoft programming language that is currently built into the excel word powerpoint outlook and access applications it’s one of the many programming languages that evolved from the basic programming language which was developed in the 1960s it was first released in excel 5 and that was in the office 1995 suite since then it evolved to encompass the applications that are mentioned in this slide vba is known as an object-oriented programming language oop this means that everything within an application is an object including the application itself objects have their own set of features and uses known as properties and methods respectively here’s an example of object oriented programming so the example using excel would be that excel is an object that contains other objects for example cells worksheets charts pivot tables shapes etc each object has its own properties for example a worksheet has a name a workbook can be opened and closed and these are a couple of a workbook’s so methods are like actions you will work with objects and manipulate them via their properties and methods throughout this course so why vba it can give you the ability to run macros automatically create user defined functions which can be used in the excel application you can use vba to control other office applications and mostly to automate recurring and repetitive tasks don’t get me wrong the power of macros is excellent in excel but vba does have some advantages so for example there are no limitations when you’re recording macros you are limited to those tasks that you can perform in the excel interface with vba you can attach code to events so that it runs automatically when the event occurs for example activating a worksheet would be an event vba allows for decision making and it has several decision-making structures ensuring code only runs when certain conditions are met the looping structures in vba ensure code runs multiple times based on a condition and then there’s forms and boxes you can use vba to create user input forms dialog boxes and message boxes in excel so we’re going to get started i have the vehicles excel file open from the video description and we are going to be recording a macro in this file now the thing is we want to prepare excel for recording a macro there are several ways that you can start a macro recording but we want to add the developer tab to the ribbon as that is one of the ways that you can record your macros review your macros so on and so forth so the first thing we’re going to do is right click on any ribbon tab home insert page layout whatever and when you right click on a ribbon tab you’re going to choose customize the ribbon in the customize the ribbon options box on the right side everything that has a check mark is a tab that’s showing on your ribbon we want to check the box in front of developer and then at the bottom you’re going to click ok and now you have the developer tab on your ribbon and let’s navigate to that tab so for parts of this course we’re going to be using this make vehicle information so we have make-believe then numbers we have year we have make model classification color dealer cost and manufacturer suggested retail price columns in here and we’re going to record a macro that is going to apply the column headings and also a little bit of formatting so on the developer tab of the ribbon in the first group the code group you’re going to click on the record macro button and don’t worry it’s not going to be recording until after we clear the dialog box so when you click that button the record macro dialog box opens and you have to give your macro a name well you don’t want your macros to have generic names so make them as descriptive as possible now of course there are rules to naming macros macro names must begin with a letter can be alphanumeric and can contain the underscore character no spaces so we’re going to name this macro capital a add capital f formatting almost together so it follows the naming convention we’re not going to assign a shortcut key to the macro to make it run later we don’t need to do that here and you have choices as to where the macro is going to be stored so by default it’s going to just be in this workbook the file that it’s going to be recorded in this workbook your other choices are a new workbook or your personal macro workbook if you store it in the personal macro workbook that workbook opens in the background every time you open excel and so the macro is available to any and all excel files we’re going to leave it on this workbook and there’s another way that you can access it from another file that you’ll see a little bit later i like to add a description to a macro so that if anyone comes behind me and they need information about what the macro is going to do the description will cover that so we’re going to type in a description box add column headers comma bold and centered period apply accounting format to column g period autofit columns a through h so that is the intent of the macro that we’re going to record so at this point once we click ok everything we do until we stop the recording is going to be recorded and i like to say this while you’re recording the macro if you make a mistake and you correct the mistake you don’t have to start all over again because it’s recording both the mistake and the correction so go ahead and click okay you’ll notice on the developer tab now where it used to say record macro we now have our stop recording icon there and we’ll use that when we’re completely done going through all the steps that we’re saving in our macro so for right now the first thing that we want to do here is right click on row heading 1 and choose insert so we get a blank row a new row one and that’s the row that we’re going to be adding our column headers in and so we’re going to click in cell a1 and we’re going to type then v i n and i’m doing it in all capital letters so vehicle identification number i’m going to press my tab key to get over to b1 and i’m going to type year tab make tab model tab again classification the next one is color the next one is dealer cost two separate words and lastly in all caps msrp for manufacturers suggested retail price after that one i’m going to just press enter so we have our headers in where they need to be and then we’re going to select row heading 1 again and we’re going to go to the home tab of the ribbon in the font group we’re going to make it bold and in the paragraph group we’re going to use the center alignment button so the headers are centered within their cells now we’re also going to add in adjusting column width in here so don’t worry about that right now the next thing we’re going to do is we’re going to select column g by clicking on its column heading so the entire column is selected and on the home tab in the number group we’re going to click on the dollar sign for the accounting number format and then the last thing we’re going to do is we’re going to select column headings a through h and i just clicked on a and dragged across and we want to auto fit these columns with right so that’s what we want to do we want to auto fit and we do that by going to the cells group over to the right on the home tab of the ribbon and in the cells group you’re going to select the format drop down and from that drop down you’re going to select auto fit column width so now every column is wide enough to display everything in the column and if we were to make entries and they were wider than what they are now it would automatically adjust the column width now typically when i’m done recording my macro before i click stop recording i just like to click on any blank cell just to make sure that nothing is selected we’re going to go back to the developer tab and choose stop recording in the code group typically you cannot undo the effects of a macro so we just recorded this macro while we were recording it we were doing the steps now what i’d like you to do is i’d like you to press ctrl z which is undo and the only thing it undid was the column auto with everything else our headings are there they’re bold and centered we have our accounting format and column g and it just undid the column autofit so we want to redo that step so we’re going to just do control y which is redo and we end up again with the result of our macro you will learn some workarounds for undoing the effects of a macro later on but for right now we want to test this macro on a different sheet so we’re on the inventory sheet tab in this file we have two other sheets let’s go to sheet two sheet two has the same data that was on sheet one initially when we came in here and this is a good sheet to test our macro on so we can go on the developer tab in the code group this is where you can use the macros button to access any macros that you may have in this file so we’re going to click on macros and we only have one ad formatting it’s already selected and on the right side you’re going to click the run button so at the end of the day you should have those column headings they should be centered and bolded and the auto width the column auto width is in effect and you have the accounting number format in column g so while we were recording our macro it was generating visual basic code in the background visual basic for applications code in the background now on the developer tab we can get to visual basic you will learn other ways of starting macro recording without using the developer tab you’ll learn shortcuts throughout the course on how to switch back and forth between visual basic for applications and the excel interface but for right now on the developer tab the first button in the code group is visual basic let’s go ahead and click on it visual basic for application opens in its own separate window and so you literally have this window and your excel window open at the same time and we’re just going to focus on the vba window right now and so before we get started in here we’re ultimately going to edit the code behind the macro we just recorded but i just want you to get acclimated to this environment this is known as the visual basic editor or vbe just so you know it doesn’t have a ribbon interface it never updated it still has the old school menu bar where you have file edit view and everything and then underneath it it has some tool bars that we use this was like pre-ribbon days how excel itself and all the other office applications used to be on the left side of your screen you may have two different panels open you have a project explorer window at the top and a properties window at the bottom if you don’t have both of those panes showing you can go up to the view menu and you can click on project explorer and then come back to view and click on properties window and you can see the shortcut keys for both of them or you could do ctrl r to bring up project explorer and f4 to bring up the properties window let’s talk about the project explorer window first for every excel file that you have open you will have a separate project so right now i only have one excel file open it’s the vehicles dot xlsx file so it creates its own vba project and it has the name of the file afterwards now i may have a few things here because i have some add-ins that create projects as well if you don’t have them you’re fine but this is a cautionary tale here because there have been times when i’ve had like five excel files open and i find myself doing some coding and then i look and see that i’m doing it in the wrong files project so i can always cut and paste it to the right project but you do want to be aware of what project you’re working in when you click on vba project vehicles.xlsx it expands and you can look up at the title bar and it lets you know that it is in that project now so just kind of get in the habit of making sure you’re in the right project it has two folders in that project microsoft excel objects those are your sheet tabs so we had the inventory sheet we had a sheet 2 and a sheet 3 and then the entire workbook is an object as well so it lists that then you have another folder called modules that folder was created when we started recording our macro actually when we finished recording our macro it created that modules folder your code is stored in modules so expand the modules folder and it created a default module it names it module one and if we were to go back over to excel now and record another macro it would also put it in module one if we were to close excel saving it properly and then reopen it and start recording a macro it would create module two it would always give it the next number module two module three you can also rename modules in here which you’ll see in a little bit so if you click on module 1 you will actually see the code window and that is everything that it created while we were recording our macro so it converted our steps into vba code and we’re going to edit this in just a little bit but i want you to have your editor window be as comfortable an environment for you to be working in so one of the things we’re going to do is we’re going to go up to the tools menu and click on options we will revisit some of these settings later in the course but when you go into options you have four tabs editor editor format general and docking one thing one setting that i want to make sure that you have checked well like make sure all of the code settings have a check mark in front of them and as we work in the course i’ll explain what these settings mean your windows settings you can actually have all of those checked as well go to the editor format tab and this is where you can set your font size so i have my font set to 14 point which is comfortable for me i can bump it up to 16 and then at the bottom i’m going to click ok so font size and if you want to go back in and change the font i’m cool with the code looking font courier font um that works for me i’m just so comfortable with it it doesn’t bother me so i just wanted you to know that you can change some of those settings in the environment for yourself and for the ones that we are going to be utilizing in the course we’ll go back in there and talk about what those settings are actually doing the other thing we want to customize before we edit our code is we want to add three icons to the toolbar that we’ll be using frequently throughout this course so what i’m going to do is i’m going to just right click in a blank area of any toolbar and go to customize and the customize dialog box opens you want to make sure you’re on the commands tab at the top and then you’ll see a list of categories that mimic the menus that are up there file edit view insert so basically you’re gonna have to tell it where it resides on the menu in order to add it to your toolbar so under categories we’re gonna select edit and then all the commands from the edit menu show on the right side of your screen and on the right side of your screen you’re gonna scroll down we’re looking for two commands the first one is comment block and the second is uncomment block so what i’m going to do when i find comment block i’m going to click and hold on it and i’m going to drag it right after the question mark on my toolbar and then i’m going to grab uncomment block and drag it right after comment block now we have one more command that we’re going to add up there under categories we’re going to click on debug and the command at the top of the list is compile project i’m going to grab that and drag it right after uncomment block so i have comment block uncomment block and compile project when we get ready to use those commands i will explain what they’re going to do for us they’re going to be kind of helpers for you let’s examine the code that was generated while we were recording our macro first of all let’s look at the information starting from the top we’ll talk about the option explicit statement a little bit later in the course don’t worry about that right now what i want you to focus on is the name of our code ad formatting it comes after the word sub and you’ll notice that both option explicit and sub are in blue that means those are visual basic for application keywords they mean a specific thing in this code and should only be used for their intended purpose it creates what’s called a sub procedure to contain our code so it starts with the sub statement and if you scroll down at the very bottom it concludes with an end sub statement you have to have both if you have a sub and not an n sub you’re going to get an error message but it did this automatically while we were recording our macro it gave it the name that we named it ad formatting and then after it it put a set of parentheses some procedures have parameters that need to be defined and that would happen inside the parentheses we’re not there yet but that’s why they’re there and they need to be there then you’ll notice several lines that are in green beginning with apostrophes those are comment lines so when we were filling out the record macro dialog box right we named it ad formatting and we put a description in add column headers bold and centered apply accounting format blah blah blah comments are meant to describe your code it’s a good idea to comment your code liberally i’ve written code before and didn’t comment it and six months later i had to figure out what the intent of the code that i wrote was so comments are really good and so when you put a description in the record macro box it comes in as comments they’re informational when you run your code or execute your code the comments do not execute and we can do a little bit of clean up there um we don’t need that blank apostrophe at the top so i’m going to just delete it and then i’m going to delete the two underneath because they’re not necessary either and then it starts our code well the first thing we did is we right clicked on row one and inserted a new row so that’s rows one colon one dot select and then selection dot insert right and so it moved everything it shifted everything down and gave us the blank row at the top and then we clicked in cell a1 and we typed it in so that’s range even though it’s a cell range a1 dot select notice the quote the double quotes inside the parentheses there surrounding a1 and an active cell which is now cell a1 don’t worry about formula r1c1 right now but activecell.formular1c1 equals whatever we typed in that cell then b1 c1 d1 e1 f1 g1 h1 same thing and then we selected row one again so at this point we’re all the way down here in the code when we selected row one again and once we selected it we made it bold so before that selection dot font dot bold would equal false when we made it bold it changed the false to true and then you have what’s known as a with end with block starts with the word with and if you go down several rows it ends with an end with statement and this is an interesting thing you’ll learn more it’s known as a construct right you’ll learn more about this construct as we go in the course but this allows you anything that you do in the paragraph group on the home tab is included in this width block bold is not in the paragraph group on the excel ribbon right but your alignments are the ability to wrap text your orientation whether you’re going to indent merging cells all of that is included in the paragraph group on the home tab in excel so all of these settings here are those things that mimic the paragraph group and what we did is we centered those headings so what happened is when we did that the dot horizontal alignment equals excel center it was changed from excel left because typically things are left aligned in a cell so all of these other settings are the default settings the only thing that changed was excel center one of the things you you want in your code is for it to be as concise as possible we don’t need everything that’s in that with block we we really would just keep the horizontal and vertical alignment but we didn’t do any wrap text orientation indenting any of that kind of stuff so we’re going to select the lines from wrap text all the way down to the dot merge cells equals false statement we need to leave that end with statement underneath that so once you have dot wrap text through dot merge cells line selected go ahead and press delete and then i’m a little ocd so i’m gonna shift tab to get the end with statement back in line with the with statement so if i have to troubleshoot code i want to make sure that i can see with and end with at the same margin if that makes sense and when we start putting our code together i’ll be walking you through how it should be formulated so when we were recording our macro we formatted column g as currency column g is the dealer cost column and we should have formatted the manufacturer’s suggested retail price column column h well it says currency in here but it’s actually accounting okay so we want both of those columns to be formatted in accounting underneath your end with statements you’ll see columns and then in parentheses in double quotes g colon g dot select the second g you’re going to change to an h so now we’re telling it when this macro runs select both of those columns and apply the format on both of those columns and that’s what we want to do and then we have where we selected columns a through h and we did our columns autofit and then i said at the end before we stop recording click on any blank cell whatever cell you clicked on it will say range and then in parentheses and double quotes that cell dot select we’re going to change whatever that cell is that cell reference we want it to be a one and so we just modified the code that was generated for our macros now we’re just going to modify our comment our second comment line here to make it accurate so apply a counting format to columns we’re going to make that plural columns g and then and h and when you move away from that line it will turn green again indicating that it’s a comment now that we’ve edited our code and we’ll test it shortly um we want to change the name of module one you want your module names to be as descriptive as possible um it’s kind of like folders that you’re organizing your code in so we’re gonna have several modules throughout this course and we don’t want them to be module one module two module three module four so we’re gonna use the properties window to make some changes to properties so we’re going to start with renaming module 1. in your project explorer window click on module 1 and then if you look down at your properties window it says properties for module one the object that we have selected and the only property a module has is the name property so if you double click on name it highlights module one for you and we’re going to talk about a prefix that we’re going to use here to identify it in a list as a module we’re going to use lowercase mod mod to indicate that it is a module and then we’re going to give it its name and that’s going to be capital f and the rest of the word first so mod first if we’re looking at a bunch of stuff in a list we’ll know that it’s a module because it has that three character prefix of mod and then when you press enter you’ll notice that it updated the name of the module in the project explorer window you can change the names of sheet tabs in here as well so in your project explorer you have that microsoft excel objects folder where you’re seeing your three sheet tabs we have one and it’s called sheet1 and in parentheses inventory sheet1 is how excel knows that sheet inventory is what it was renamed to but the system identifies it as sheet1 and then we have sheet2 and we have sheet3 we’re gonna click on sheet3 and in the properties window you’ll notice that there are two name properties the one at the top is indicative of the system name right so what excel knows is that name is the name property at the top my arrow got a little skewed there and then you have a name property lower down in your properties window and the one that’s lowered down is whatever you decide to name that sheet so the second name property the one that is not in parentheses you can double click right on name and it selects sheet three and we’re going to type new vehicles two separate words just like you would do it in excel if you were renaming the sheet tab and press enter so notice in your project explorer now you have your sheet1 which had already been renamed to inventory sheet 3 which we just named new vehicles we added the compile project icon to our toolbar and what that does is it kind of goes through your code for you and it checks to make sure that everything is okay if there’s a problem it will let you know by highlighting that problem so what we’re going to do is make sure you’re clicked anywhere between your sub and in sub statements you can be anywhere between those two statements and go up to your toolbar and find your compile vba project icon that we added there and just give it a click and it dims out and you didn’t get any notifications of anything wrong so your code is good good habit to get into good icon to have on your toolbar so now that we’ve modified our code we want to save this file and if you look up at the top you know your title bar is vehicles.xlsx the standard four character excel workbook extension if we don’t save this file in the right way it’s as if we didn’t record a macro and we wouldn’t have any vba code in it so you have to save it as a macro enabled workbook as a matter of fact let’s check this out on the toolbar you have a save button and notice when you hover over it it wants to save the file go ahead and click on that save icon and you get this pop-up message that says the following features cannot be saved in macro free workbooks and then it says vb project that’s your visual basic project to save a file with your code in it click no and then choose a macro enabled file type to continue saving as a macro free workbook click yes we are going to click no when you click no it gives you the save as dialog box now we’re going to leave the same name vehicles but we need to change the type right underneath the file name where it says save as type click on excel workbook and we want the second choice excel macro enabled workbook again if we just save this as a regular excel file it’s not going to keep your code so we need it to be macro enabled and part of that is for your security which i’ll explain in just a few moments and after we have it set as excel macro enabled workbook we’re going to go ahead and click save so now if you look up at the title bar it has a different extension dot xlsm that’s your macro enabled excel workbook extension and so it will retain our code and now that we’ve saved it as macro enabled we’re going to switch over to excel to test our edited code there’s a couple of ways that you can switch over to excel back and forth between excel and visual basic first of all and i’m not going to use this way but the first button on the toolbar is excel so i can use that to switch back over to excel i’m a real shortcut key person so alt f11 will also switch me back and forth between excel and the visual basic editor so i can just keep doing alt f11 and you see that it switches back and forth between the two separate application windows that are open when i am back in excel i’m going to do control o to get the open dialog box to display so this is where we’re going to open the vehicles 2 file and by the way if you look at my screen we have two files we have vehicles and vehicles too right we have two versions of vehicles i’m pointing to the macro enabled worksheet and then we have our original one which is just a regular excel file and if you look closely the icons are slightly different the macro enabled worksheet icon has an extra little thing in its lower right hand corner than the other regular excel icons so we want to open the vehicles to excel workbook and so we have two excel files open we have our macro enabled vehicles and we have vehicles too earlier when we went to record our macro i said if you save your macro in the personal macro workbook it opens behind the scenes every time you open any file in excel this is a workaround we save that macro in the vehicles file but we can use it in vehicles too as long as the vehicles dot xlsm file is open i don’t typically save in the personal macro workbook there are occasions that i do that if i’m going to use it across a wide range of files but typically my files are structured so differently that macros from one won’t work well with others so what we’re going to do here is we want to use the macro that we recorded the add formatting macro we want to use it in this file another way of getting to your macros instead of going to the developer tab is you can go to the view tab of the ribbon and all the way to the right the last button is macros so check this out if i do the drop down arrow under macros i can view or record them um and i’m going to just go to view macros notice that it gives the file name exclamation point and then the name of the macro that vehicles.xlsm file has to be open and it’s showing you macros in all open workbooks if we did the drop down and we choose this workbook right it’s showing there as well because the other one’s open so you can access it but it really resides in that other file vehicles the macro enabled vehicles file and so we’re going to just click on vehicles xlsm exclamation point ad formatting and choose run so you’ll notice that it gave us our headings they’re centered and bolded notice one of the changes we made is we had it do the accounting format on the msrp column right so that worked we also cleaned up some comments and stuff in there as well so you will see that if you have the file that contains the macro open you can access it from other excel files that you open also notice that the active cell is cell a1 because we changed that as well we’re going to close this vehicles 2 file without saving any changes to it so i’m going to just close that file when it prompts me i’m going to say don’t save the changes and i still have my macro enabled vehicles file open so in our macro enabled vehicles file first take a note look at your um sheet tabs so we renamed sheet 3 new vehicles and that’s what shows on the sheet down there we did that in the properties window in the visual basic editor so another change that we made in there that you’re seeing in here and i mentioned earlier and we saw that you can’t really undo the effects of a macro when we tried to do it it didn’t really undo it it only undid the column autofit right so we saw that but i said that there is a workaround like let’s say on the sheet 2 right that we wanted to test the macro and it’s already been run so we certainly don’t want it to put another row in here right at the top so on sheet 2 what i’m going to have you do is just delete row one so i’m just right clicking on the row header and choosing delete and now i’m gonna go to the view tab drop down view my macros and i’m going to rerun this macro so it puts the headings back in right we see that we have the currency format on or accounting format on the columns g and h and it put us in cell a1 so you would have to kind of manually delete the effects of a macro to rerun it on a sheet like that we’re going to go ahead and right click on the sheet2 sheet tab and we want to delete sheet 2 and confirm the deletion so now we have two sheets in this macro enabled file we have our inventory sheet and we have our blank for right now new vehicle sheet let’s go ahead and save and close this vehicle’s file now we’re going to explore what happens when you open a file that is macro enabled so what i’m going to do is i’m going to just relaunch excel and go to open and navigate to wherever you saved your macro enabled vehicles file and when you’re there you can go ahead and select the vehicles macro enabled file i’m going to just double click on it here and open it now because it’s macro enabled you’re going to get the yellow band underneath the ribbon that says security warning macros have been disabled and then there’s an enable content button microsoft does this by default that’s the default security settings for a file that contains macros that has been saved as macro enabled and it’s to kind of protect you so if you receive a file from an unknown source you probably do not want to enable the content it’s not the typical way of delivering viruses to computers anymore but it used to be delivered via macros that were infected via viruses so if it’s from a trusted source you can go ahead and enable the content which we’re gonna do now that can be annoying if you’re working with a lot of macro enabled files and you know the people that are creating them maybe your colleagues yourself you all work in teams or something like that so we’re gonna modify a truss center setting and you’ll see how this works so what we’re going to do is we’re going to go to the file tab and all the way at the bottom on the left you’re going to go to options on the left side of excel options at the bottom you’re going to click on trust center and then on the right you’re going to click on trust center settings so the first thing i want you to see here is on the left side click on macro settings so the default setting is to disable vba macros with notification that’s what the yellow band that we got and i wouldn’t suggest changing that what you can do to make it a little bit more convenient and you don’t get that yellow band when you’re you know using files back and forth amongst your teammates or colleagues is we can set either trusted documents on the left or trusted locations i always do trusted locations it’s more global than trusted documents so click on trusted locations and i’ll tell you um how this works right so i set up a folder on my desktop it’s called files for video description and it’s where i’ve stored all the files that we’re going to be using during this course and i want to set that as a trusted location so any of the macro enabled file formats that we’re going to be using during this course that folder and its any subfolders will be a trusted location so what i’m going to do underneath here is i’m going to click on add new location toward the bottom right and then i have to navigate to that location so i’m going to just do that i know it’s on my desktop so you’re navigating to wherever you put the files that you’re going to be using so the folder name for me is files for video description and i’m going to click ok and then i’m going to say subfolders of this location are also trusted so any folders within that folder would also be trusted and then i’m going to click ok and once i do that it shows up in this list of trusted locations so it could be a shared network drive if you’re all of your files that you and your team are working together on are in a specific shared network drive you can use that as a trusted location so that you don’t get the yellow warning and have to enable content at the bottom we’re going to click ok and then let’s close and reopen this vehicle’s macro enabled file so when i open it it’s in a trusted location now so i don’t get the yellow banner under the ribbon i don’t have to enable content and i didn’t disable the default trust center setting so that’s still in place but this file is now in a trusted location so i’m able to open it with no problems just to recap what we covered in this introductory lesson one on the getting started section we reviewed what you can do with visual basic for applications you learn that it is an object oriented programming language that is part of the microsoft office suite you learned that it’s the code that is produced in the background when you record a macro you also learn the advantages of visual basic for applications over recording macros we moved into customizing the ribbon to add the developer tab and we recorded a macro in excel that added and formatted column headings on a worksheet we then toured the visual basic editor environment and were able to edit the vba code produced by our recorded macro we also changed some vbe settings including font size and we saved a macro enabled file you tested your edited macro and lastly modified some trust center security settings by adding a trusted location you also understand the importance of saving a macro enabled workbook or else all of your work would be lost before we get hands on again in lesson three we need to go over some background information and i should mention at this point that this slide deck is also in the video description and you can use it for your future reference no one is expecting you to memorize all of these things so we need to talk about the excel object model you need to understand collections and how to reference objects and also how to simplify object references you learned that vba is an object-oriented programming language and we discussed that that means that excel is an object that contains objects objects that have attributes known as properties can be manipulated through vba and objects also have methods which are actions that can be performed on them via vba so this is a foundational lesson here and again you’ll be able to reference the slide deck so the excel object model hierarchy is a hierarchical structure of excel and all its objects with excel the application residing at the top of the hierarchy so you can see on this slide that we have the application at the top of the hierarchy here on the left and then underneath the application you would have add in objects window objects workbook objects and then we expand on the workbook object a workbook object has a name a visual basic project a workbook also contains worksheets worksheets can contain comments hyperlinks names ranges and pivot tables for example so a simplistic example is over on the right where you have excel the application which is an object at the top of the hierarchy then you have a workbook a worksheet is an object of a workbook and a range is an object of a worksheet and you’re going to be seeing this as we’re working in this video course the next thing you need to understand are collections now collections are key in vba programming a collection is simply a group of objects of the same type a collection is also an object collections are useful when you need to work with not just one worksheet but with a couple of them or all of them you’ll learn later that your vba code can loop through all members of a collection and do something to each one we have a table that shows the collections the most commonly used collections in visual basic so you have the workbooks collection and it would be all currently open workbook objects so all currently open cell files are part of the workbooks collection you have a worksheets collection and it’s a collection of all worksheets contained in a particular workbook the charts collection is a collection of all chart objects so these are excel worksheets that only have charts on them a collection of all chart objects contained in a particular workbook object a chart sheet is not part of the worksheets collection as it is not considered a worksheet it is in fact a worksheet but it only has a chart on it and then you have the sheets collection plural a collection of all worksheet objects contained in a particular workbook object so you have a worksheets collection and then you have a sheets collection what is the difference the sheets collection contains all worksheets and all chart sheets whereas the worksheets collection is just all of the worksheets and then the charts collection is just all of the chart sheets the sheets collection combines them all so you can reference these things sometimes across different collections as you will see when we resume with our hands-on stuff in order to access the objects that you want to reference in your code you’re going gonna have to learn how to reference them so you can work with an entire collection quite easily but it’s most often the case that you’ll need to work with a particular object in a collection for example if you need to work with a particular worksheet you’ll need to know how to reference it when it comes to referring to an object in a collection you can either use its name or its index number to reference a single object from a collection you put the item’s name or index number in parentheses after the name of the collection so you have two examples on this slide that refer to the exact same object the first worksheet in the workbook so worksheets and then in parentheses and double quotes sheet1 by name or worksheets and in parentheses 1 by index number when you refer to an object by its name the name must be enclosed in quotes when referring to an object by its index number you need to know that the first object in the collection has the index number of one using a workbook with three worksheets as an example sheet one has an index number of one sheet two would be two and sheet three’s index number would be three and index numbers are not enclosed in quotes we’re going to spend a few slides on referencing objects so each worksheet in the worksheet’s collection is an object in two collections which we mentioned already worksheets and sheets each chart sheet is an object in two collections charts and sheets so there’s another example of how to refer to sheet1 you could use the sheets collection instead of the worksheets collection like a typical office application you get several ways of referring to the same object you know there’s multiple ways of getting the same thing done in excel and along the way you’ll find a way that works best for you although i do have some suggestions so all excel objects are under the application object in the hierarchy remember excel the application is at the top of the hierarchy you access these objects by moving down the hierarchy and connecting each object with the dot operator you can even access the value of a particular cell on the worksheet by using the range object and you saw that when we reviewed our code there is no cell object in vba really it would be the range object even with one element and here are additional examples on this slide of object references so referring to a specific workbook application dot workbooks and then in parentheses and double quotes the name of the workbook including its extension and then a specific worksheet in the workbook if you’re using the entire hierarchy application.workbooks the name of the workbook and then dot worksheets 1 the first sheet referring to the value of a cell your application.workbooksname.worksheets1 dot range a1 dot value the last example is known as a fully qualified reference it specifically refers to all the objects in the hierarchy from application down to range so again you have this power point in your video description for future reference now i’m going to tell you about simplifying object references you want it to be as concise as possible and i i mentioned that earlier it’s easier to write and easier to troubleshoot should there be any issues so visual basic for applications can assume some of the object references for you for example it assumes that the workbook’s collection is within the application object and that means that you don’t have to reference that object in most cases another example here is that if you only have one workbook open one excel file open it is the only one in the collection so vba assumes it is the active workbook and you don’t have to reference the workbooks collection if the first worksheet is the active sheet in the workbook you don’t have to reference the worksheets collection as vba will assume it so gonna go over these examples the code that refers to the value of a cell so starting with the application application.workbooks the name of the workbook in parentheses and double quotes dot worksheets 1 by index number dot range a1 dot value if vba is assuming the application object it would just start with workbooks in the name of the workbook so on and so forth if it’s the only open excel file it will assume the workbooks object so you can just start with worksheets and if the first sheet is the active sheet all you would have to reference is range a1 dot value and so the last example is the most concise and therefore preferable you don’t want to have to type all of this line unless you just like to type like that my arrow drawing is getting horrible here but you don’t have to type all of that why would you want to type all of that maybe fat finger to keyboard whatever set of circumstances could happen when all you would have to type would be this and also if someone is coming behind you or if you have to troubleshoot the code this is a lot more difficult to troubleshoot because it has more on this line than the last and preferable example now that we’ve gained an understanding of the excel object model hierarchy collections and how to reference objects we’re ready to dive into lesson three which is working with procedures and functions previously you were introduced to modules and sub procedures when we edited the vba code that was generated by the macro we recorded you’re going to get more in-depth knowledge on those two topics during this lesson so we’re going to start by doing a deeper dive into modules and then procedures then we are going to move on to creating a standard module as well as creating a sub procedure you’ll learn different methods of executing procedures or running them including how to call procedures in this lesson then we’re going to create a function procedure and we’re going to use the immediate window within the visual basic editor to run it you’re going to learn how to get context sensitive help within the visual basic editor which is really cool we’re going to use the vehicles macro enable file that we created as well as another file in the video description and it’s another excel file named received vehicles those two files need to be in the same directory for this lesson you saw earlier that when we recorded a macro vba created a module to store the visual basic code in and so we discussed how a module is a container of sorts that stores your vba code well there are two different types of modules there are class modules which allow you to create your own objects and we’ll begin using class modules when we get to lesson seven and then there’s standard modules one of which you already saw and it uses the application objects we also discussed that our code was put in a procedure specifically in our case it was a sub procedure began with the sub statement and end it with the n sub statement so a procedure tells the application what to do as it defines a specific task specifically it’s a named group of statements that are run as a unit for example a block of code a sub procedure defines specific tasks like our ad formatting sub procedure it told the application what to do so insert a new row and then we typed in the headers that kind of thing when responding to events you’ll learn about these later they can be known as event procedures there are also function procedures and you’ll be introduced to creating function procedures during this lesson a function procedure actually returns a value property procedures are outside of the scope of this course but they exist and they’re are series of statements that allow a programmer to create and manipulate custom properties for example read-only properties for forms before we dive in we’re going to go over the naming rules and conventions for procedures now the rules cannot be broken conventions are suggestions but just so you’re aware of them you need to know what they are and i use conventions as well as the rules so if you inherit an excel macro enabled workbook and you’re looking at somebody else’s code they may be using the conventions so anyway let’s go over this and then we’ll get hands on and learn more about procedures and modules by recording another macro so when we’re naming procedures the name may be up to 255 characters it can be alphanumeric the first character must be a letter you can’t use any spaces or any of the special characters listed on the slide and the names must be unique within a module so you can’t have to add formatting sub procedures within the same module it will disallow it you just can’t do it and then the conventions begin the names with a verb use proper case for each word within the name when two or more procedures are related place the words that vary at the end and there are some examples so you could name a procedure close workbook get new inventory get selected date begin and get selected date end so if you’re looking at these in a list the ones that have the words that vary at the end would still be all together in the list so you know that they’re related procedures i’m back in the vehicles macro enabled file that we created earlier and i’m going to switch to the new vehicles sheet tab now we’re going to record a macro again to get this lesson started and along the way and going forward beyond this lesson whether we’re recording macros or we’re writing vba code from scratch we’re also going to be using properties and we’re going to be using methods now you saw properties we use properties to change the name of a module we use properties to change the name of this particular sheet tab and a method is an action that is taken on an object so you’ll learn how to access methods along the way as well and i want to show you another way of starting a macro recording without accessing the ribbon so i’d like to direct your attention to your status bar and it’s at the very bottom underneath your sheet tabs of your excel screen so the area all the way at the bottom now it starts with ready you may or may not have num lock and some of the other stuff that i have on my status bar but in particular i’m interested in making sure that you have this icon i don’t know it looks like a spreadsheet with a little camera on it in a way and if you don’t have it i’m going to show you how to get it down there you can right-click in a blank area of the status bar and you get the customize status bar menu and notice that a lot of the things on my customize menu are already checked which means they will show in my status bar as appropriate so for example caps lock and num lock my num lock is on and that’s why it’s showing down in the status bar my caps lock is currently not being held down i’m not enabling caps lock on my keyboard i should say so that one is not showing there but where i to enable it it would show in my status bar the setting that we’re interested in having you have down there is macro recording that’s that icon so if it doesn’t have a check mark in front of it and you click on it it will check it if it does and you click on it it unchecks it like it just did on mine so i’ll click on it again and then you just click on any blank cell you want to make sure you’re in cell a1 before we start recording this macro and what we’re going to do is we’re going to go down to that icon in our status bar that looks like a spreadsheet with a looks like a camera lens to me but if you hover over it it says no macros are currently recording click to begin recording a new macro and we’re going to do just that and it gives us our record macro dialog box so you could start this process from the developer tab or you can start it from that icon on your status bar now for this macro we want to name it using our rules and conventions so we’re going to start with a verb capital g get capital n new capital v vehicles because remember you can’t have spaces you could use the underscore character but i prefer to just use this convention we’re not going to use the shortcut key we’re going to store it in this workbook and we’re going to click in the description box and we’re going to type copy and paste data from the received vehicles file and again it once we click ok it’s ready to follow our instructions so go ahead and click ok notice that the icon on your status bar now looks different and it looks like a stop button and if you hover over it it says click here or a macro is currently recording click to stop the recording so we can start and stop it from the status bar as well so what we want to do is we want to open the received vehicles file that is in the same directory as this file and i’m going to use the shortcut combination control o to bring up my open dialog box i’m already in the proper directory for myself and i’m going to just double click that received vehicles excel file to open it and once it’s opened you’ll see that it has a limited amount of data there’s some then numbers and dealer costs and so what we’re going to do is we are going to click anywhere on the spreadsheet it’s only on sheet 1 and we’re going to hold down our control key and type the letter a and the letter c so a selects everything and c is the copy command and now we want to switch back to our vehicles macro enabled file so one way to do that is we can go to our view tab on the ribbon the next to the last button is switch windows and i’m going to use i’m going to just click on vehicles to switch back to that file we’re already in cell a1 in the vehicles file on the new vehicles tab i’m going to just do control v as in victor to paste in the information we have one more step we’re going to take before we stop this macro recording i’m going to switch back to the received vehicles file and i’m going to just close it and now i can go down to my status bar and stop the recording before we switch over to the visual basic editor to look at the code that we just generated just wanted to give you some examples of methods so i’ve said that a method is an action that is taken on an object so clear contents is a method of the range object it would empty the cells delete everything that’s in the cells clear all of everything that’s in the cells in the range add is a method of the workbook’s collection object and it’s used to create a new workbook and then you have activate and that’s a method of the worksheet object it’s used to activate a worksheet you know if i click on the inventory sheet tab i’m activating that sheet so examples of how you access the methods you start with the object so range a1 colon b11 in parentheses and double quotes you use the dot notation and then you can access the method clear contents workbooks dot add worksheets you have to give it the name or the index number of the sheet dot activate so we’re seeing the dot notation used to call methods as well and when you’re in the editor and you do the dot it sometimes gives you and usually gives you built-in help that it will list the methods that are available for that particular object i’m going to just delete this text box off of my spreadsheet then i’m going to alt f11 to switch over to the visual basic editor the first thing i want to point out is the project explorer window the upper left corner and if you look in your modules folder now we renamed what used to be called module 1 mod first so because we had closed the file and reopened it when we recorded this macro it created a new module since module 1 wasn’t in use anymore it used that and so we would have to go there to find the code that we just recorded the macro for so i’m going to switch to module one and it created a sub procedure we named it get new vehicles we put stuff in the description explaining what it is and you know we can get rid of those extra green lines that are preceded by apostrophes that don’t need to be there just to kind of clean up the code of course you want it as concise as possible when we did control o the open command it did this activewindow.close and then workbooks.open right so open is a method of the workbooks object close is a method of the active window object so we did workbooks open we had to give it the name of the file and these characters here so it says file name followed by a colon equal then there’s a space and an underscore the space and the underscore means the rest of this syntax the rest of what is needed here is on the next line it’s called the line continuation character space and underscore combined like that in visual basic is the line continuation character and that’s what we have after file name colon equal if we didn’t have that there we would get an error message because it’s saying hey you gotta give me the path to the file name including the file name so it just goes to where i have my on my hard drive users trish desktop files for video description and then it’s in that received vehicles the name of the file is receive vehicles.xlsx and that line starting with c begins with an open double quote and ends with a closing double quote and then i scrolled a little bit when i got over to that other file receive the vehicles and it took note of that that’s this active window small scroll down and then we did control a to select everything which is a 1 through b11 dot select select is a method of the range object and then we have range a2 activate and then we did copy so we actually just did control ac and it created those three lines of code and then after we copied it we switched back over to the vehicles macro enabled file we click in cell a1 and then we pasted what was on the clipboard onto the active sheet starting in cell a1 and then we went back over to received vehicles file calling the activate method and then we said close that window and then of course with every sub statement you have your n sub statement at the bottom now that we’ve reviewed this code that was generated from us recording that macro there’s a few things we want to do we want to rename module one so it’s more specific and we want to create a new sub procedure from scratch in the newly named module so let’s start in our project explorer window i’m gonna just click on module one go down the properties window double-click name and we’re gonna call this mod remember that three character prefix which is a convention not a rule mod new vehicles and i’m using the proper casing all mushed together and then i’m going to press enter so we have mod first and mod new vehicles in mod new vehicles click at the end of your in sub statement and press enter we’re going to go to the insert menu and we’re going to choose procedure and this is a microsoft product so this is just one way of doing this in the add procedure dialog box we’re going to start work our way from top to bottom right in the name box we’re going to name this procedure move cells so capital m capital c mushed together procedure name move cells the type defaults to sub for a sub procedure and we’re going to talk about the scope in a little while but we’re going to leave it on public and we’re going to just click ok so a couple of things happened it automatically put a dividing line between your get new vehicle sub procedure and this new sub procedure and it has the keyword public because we did it from within the dialog box and again you’ll learn about scope in a little while and that’s what public speaks to it gave us our sub and our n sub statements and of course the open and closing parentheses at the end of the first line so what i’m going to have you do is i’m going to have you click outside of the closing parentheses public sub move cells press enter twice and then press the tab key on your keyboard i talked about code being concise but also you need to know this you’re going to probably end up spending more time troubleshooting code than actually writing code it’s just the way it goes and there are certain things in terms of how you format you your code that makes it easier to review when you’re troubleshooting and indentation is one of those things i like to look at my code and see the public sub and in sub statements at the same margin and that’s what we’re doing by indenting here so now you’re going to type a few lines of code four lines to be exact and you can take them off of my screen the first line is going to be columns plural open paren open double quote b close your double quote close your paren so columns b so we’re referencing column b you’re going to use the dot notation and start typing select and if i don’t type it with a capital s when i press enter at the end it will automatically capitalize it for me and now we’re going to type selection dot cut enter i’ll explain it all when we get it in and then we’re going to type columns open paren open double quote g close the quote close the paren dot select active sheet dot paste and typically i like to have a blank line after public sub and a blank line before end sub so my previous block my get new vehicle sub procedure i’m going to just get that blank line above the n sub statement so basically it’s going to select everything in column b and it’s going to cut it put it on the clipboard and then it’s going to select column g and it’s going to paste what was in column b into column g congratulations you just wrote four lines of vba code from scratch now earlier we added some buttons to our toolbar and we used one of these earlier be anywhere in between your public sub and your in sub statements and go on and click that compile vba project that we put up on the toolbar earlier and again if there were any errors in your code you would be notified of it it’s kind of line checking your code you accessed the select method of the columns object and once you have something selected it is known as the selection object so you access the cut method of the selection object and the paste method of the active sheet object in that code block so let’s go ahead and save is save on the toolbar or you could do control s and then we’re going to do alt f11 to switch back over to excel so we can test this code there is another way that you can access your macros in here so earlier we accessed our macros from the developer tab by using the second button macros we also accessed it from the view tab of the ribbon by going to the last button which is macros well there’s another way of doing it and it’s a shortcut key so you can use alt f8 to open the macro dialog box and so in here you’ll see your ad formatting macro your get new vehicles macro both of those were based off of macro recordings i should say and then move cells is listed in here even though we created that sub procedure from scratch so this is just another way alt f8 that you can open the macro dialog box and we’re going to double click the move cells procedure so you could click it once and then choose run or you could just double click it to run it and it did exactly what we asked it to do just very quickly selected everything in column b cut it and then pasted it into column g so the next part we’re going to do is going to further our automation what we want to do is we want to edit the add formatting sub procedure so that it works on this sheet the new vehicle sheet that we’re currently on and before we do that we’re going to delete everything on this sheet new vehicles we’re going to do control a to select everything and then we’re going to just press delete and then just click in cell a1 now we want to go back over to the visual basic editor alt f11 will get you there and in the project explorer we’re going to double click mod first which is where our ad formatting sub procedure resides now notice the first two lines in our code block that’s when we right clicked on row one and we inserted a new row well we don’t want to do that again we want to keep the row headings that we already have so we don’t want it to insert a blank row above row one which now contains the headings so we need to delete just those two lines of code rows one colon one dot select and selection dot insert shift blah blah blah the first two lines so i already have them selected and i’m going to delete those two lines and then what i’m going to do is in your project explorer window go ahead and double click mod new vehicles again to get back into that module where we have our get new vehicles which is the result of a macro and notice when you do a macro it gives you in green that it’s based off of a macro you didn’t create this code and then whatever description you put in right so we should probably add comments just so i can be a good example here to our move cells sub procedure i’m going to click at the end of the public sub line and press enter twice and then i’m going to type an apostrophe now when you type an apostrophe it’s like saying the visual basic hey heads up the next thing i’m going to type is going to be a comment which means you’re not going to execute it when the code executes it’s just there for informational purposes and we’re going to say that this is going to select and cut contents of column b and paste into column g and then when i press enter it will turn that line green because we started with an apostrophe before we do the next bit i just want to go over that there are different ways to execute your procedures or run them within the application or in vba so we’ve used some of these already um we’ve used the macro dialog box the ones that are highlighted on in yellow on this slide we will use during this course so you’ll later on we’ll use the run sub user form button on the vbe toolbar we’ve already used the macro dialog box we’re going to call the procedure from another sub procedure which is the one the example we’re going to do next later on we’re going to add a button to the quick access toolbar in excel you can also attach the procedure to an event which you will learn later and also you can run it from what’s known as the immediate window in visual basic editor so many different ways to execute procedures so like i mentioned we’re going to be calling the procedure from another sub procedure in this lesson we’re going to click at the end of the end sub statement in your move cells public sub procedure and we’re going to press enter twice we’re going to create another sub procedure here going to do it in a different way and it’s going to be known as the calling procedure you’ll see how this works and i’ll explain more after we get it done now we’re going to actually just type this in we’re not going to use the add procedure insert procedure dialog box and so we clicked after in sub we pressed enter a couple of times and we’re going to type sub and then we’re going to name it get new inventory and press enter twice so you get the line the dividing line between the move cells sub procedure notice we didn’t have to type the opening and closing paren or the end sub statement the visual basic editor will supply you with those when you’re typing it from scratch so now we’re going to press i’m going to just do shift tab to out dent let’s do a comment here i’m trying to be a good example we’re going to type an apostrophe and we’re going to put this is a calling procedure that is calling three other procedures and press enter at the end of the line it turns green press enter again and then tab to indent we simply need to give it the names of the procedures so this is known as a calling procedures and the procedure names we’re going to type are known as called procedures so we are going to type get new vehicles enter move cells enter add formatting enter it should look like this on my screen so get new inventory’s purpose is to kind of bundle those three other procedures together in the order that they’re listed there and it will execute them when it is executed so we get three for the price of one we execute get new inventory and it executes three other sub procedures for us go ahead and compile your project and save we have our three procedures that are called procedures in our get new inventory sub procedure two of which reside in this same module ad formatting resides in mod first we’re going to talk now about the scope of procedures and why it’s possible that we can access the ad formatting procedure from a different module so of course we’re going to review the scope of procedures on the slide because again the slide deck is in the files in the video description and you’ll be able to re use it for future reference so scope determines where the procedure may be used you have basically three different scopes really two so the first one is public if a procedure declaration is preceded by the keyword public this makes the procedure accessible to all modules in the visual basic project if the procedure declaration is preceded by the keyword private this makes the procedure available only in the module where it resides it cannot be accessed from any other modules or from the excel workbook and then you have undeclared so we have no private procedures at this point if no keyword is inserted at the start of a sub or a function declaration the default is public okay so i’m going to switch back over to the visual basic editor and we’ll take a look at this and i’m still in mod new vehicles so we have the result of a macro we recorded a macro and we named it get new vehicles it simply named it sub it didn’t put public or private so it’s considered undeclared which means it’s public then we created a procedure by using the insert menu and because in there and i’ll bring up that dialog box the scope is defaulting to public so when we created the move cells procedure it added the public keyword and then we create it from one from scratch sub get new inventory we didn’t type public before sub we left it undeclared so all of these are public procedures and if we go to mod first add formatting is also undeclared which means it’s public and i look at the end of that and i want that blank line above in sub so i just modified it and did that so because ad formatting is public i’m going to go back to mod new vehicles we can access it by calling it from this module that’s why that’s possible the scope of procedures matter now one other little fix we’re gonna do because i already know it’s going to be an era and you may not even have this line in your get new vehicles sub procedure in mod new vehicles but that first line of code since get new vehicles is included in our calling procedure if we have the first line saying active window close it’s going to just close the file and then it won’t be able to run the rest of the code so that very first line active window close if you have that line you know could cause you to have an issue with the code if you don’t have that line as your first line if your first line is workbooks dot open file name so on and so forth you’re good to go but if not you want to delete that first line active window closed we’re going to leave it at the bottom but not at the top and then go ahead and save your code and now we’re ready to alt f11 to switch over to excel and we’re on the new vehicle sheet in cell a1 we’re going to do alt f8 to bring up our macros box and we want to run our calling procedure get new inventory so i’m going to just double click it and my screen will flicker for a moment and then ultimately stop okay so what happened well it ran the bundle let’s switch back over alt f11 the first thing that it did is it ran get new vehicles so it opened the received vehicles file it selected everything and then it copied everything and then it went back over to our vehicles macro enabled file made sure it was in cell a1 and it pasted the data and then it went back over to received vehicles file and closed it after that it did the move cells sub procedure so once it brought in that information from received vehicles it selected everything in column b and it pasted it it cut it and then it pasted it in column g and then after that it did add formatting which is in mod first and that’s where it added the headings for us right so it added our column headings and we didn’t want it to create a new row there because it came in with a heading row so we had already modified this it did the currency formatter accounting number format and it auto fitted the columns it also made the headings bold and centered in their cells so it ran the bundle we ran one sub procedure that called three other procedures so when i go back and look at it in excel we’re still on new vehicles right it moved the dealer costs to the appropriate column applied the appropriate formatting to it and it added the headings instead of the headings that came in from the received vehicles file and the formatting that it did so you saw that calling procedures lend themselves to efficiency but there is further efficiency to be had earlier we discussed how sometimes a sub procedure is known as an event procedure and that happens when you attach it to an event so first thing we’re going to do here is we’re going to do control a on this new vehicles sheet to select everything and then we’re going to press delete we’re going to clear the sheet just click in cell a1 and switch back over to your visual basic editor now on the left side you attach to in order to make something an event procedure you have to access an object’s events so we’re going to double click in the project explorer window we’re going to double click sheet 3 new vehicles now notice at the very top of your screen you have two different drop downs above option explicit which we still haven’t talked about but we’re getting there you have a general box and to the right you have a declarations box both of them have drop downs on their far right sides the left side where it says general is known as the object list the right side where it says declarations currently is known as the procedures or events list so we’re going to do the drop down arrow to the right of general and the only thing because we have sheet3 selected the only object we’re going to see is worksheet so we’re going to select worksheet and it creates this whole like sub procedure framework it’s private so it’s only available within where we’re putting it it’s attached only to the new vehicle sheet which the system knows as sheet 3 right so the first thing the default event for a worksheet if you look at the right now where it used to say declarations it says selection change that’s just the default event that’s not the event that we want what we want to happen is we want our calling procedure to run whenever the new vehicle sheet is activated so we’re going to do the drop down all the way to the far right of selection change and these are all worksheet events right activate before delete calculate you have a whole list we want to select the activate event so now it gives us the framework for a private sub procedure that it names worksheet underscore activate typically with event procedures you don’t change the names right it’s kind of like hard coded so it’s that particular worksheet activate event that we’re going to code so we don’t need this second block we don’t need this this is just what was created as soon as we selected worksheet it selected the default event which is selection change so we can just delete that click at the end of the parentheses on the private sub worksheet activate line press enter twice just so you get that blank space again we’re going to press tab so it’s indented and we’re simply going to call our calling procedure by name we named it get new inventory so that’s the one that has the the three called procedures within it so we’re saying whenever the new vehicle sheet is activated go ahead and run that bundled calling procedure known as get new inventory go ahead and compile your vba project using the toolbar you want to get in the habit of doing that and save and switch back to excel just make sure you’re in cell a1 on new vehicles which we deleted everything off of and now we’re going to go to our inventory sheet tab at the bottom and then we’re going to click back on the new vehicle sheet tab to activate it and voila as soon as we activated that sheet it ran our get new inventory calling procedure so we get the same result we didn’t have to do alt f8 to get into the macros dialog box to make it run or anything like that we simply made it an event procedure and it was the activate event for this particular sheet we are going to once again clear this sheet by doing control a and delete just click back in cell a1 and go ahead and save your vehicle’s file so now we’re ready to create a function procedure and if you remember from earlier a function procedure performs a calculation and returns a single value or an array of values so differs from a sub procedure so when you create a function procedure in vba it can only be executed in two ways compared to the nine ways you can execute a sub procedure you can call the procedure from a sub procedure or another function procedure or you can use the function in a worksheet formula it becomes a user defined function in your excel application and you’ll see both of these play out when we do this we’re going to create a new module for this so i’m going to just go up to the insert menu in the visual basic editor and i’m going to choose module so it gives me a new module one and and let’s rename that module using the properties window we’re going to call it mod and then capital f function and in this module we’re going to create a function and what it’s going to do is we’re going to give it different values for an msrp and depending on the value it’s going to display a message and once we get it typed in and stuff it’ll be easier to kind of explain it to you so in your mod function i’m going to click at the top after option explicit and just press enter and we’re going to type the word function and a space and we’re going to call it msrp so all of that is capitalized and then capital s status and then in the parentheses we have to have an open parenthesis we’re going to type msrp that’s a parameter you’ll also hear it as an argument so we have to pass the function an argument in order for it to give us a value as its return and after that you’re going to press enter and notice it gives you the end function statement just like it does when we do a sub procedure and it gives us the end sub statement so i’m going to press enter again and i am going to press my tab key to indent it’s just a structure thing visual basic doesn’t care now we’re going to build what’s known as an if construct it’s more specifically it’s an if then else if else construct which is a lot to say and can be overwhelming it’s similar to the if function in excel you’re being rudely introduced to it for this function but you’ll get a deeper dive in control of flow structures in a later lesson so i will explain this after we get it typed in so we’re going to type if and then msrp we’re going to do the less than symbol 20 000 no punctuation on the 20 000 and type then and press enter now tab a little bit more one more time so if the msrp value is less than 20 000 then if that is true it’s going to do what we say on this line we’re going to type now we’re going to type msrp status the name of our function equals and in double quotes less than 20k and close your quotes so if the msrp value is less than 20 000 it’s going to say as the function return the result of the function it’s going to display the text less than 20k press enter and then shift tab and you’re going to type else if and it’s all one word initial capital letters msrp less than thirty thousand then next line down you’re gonna tab msrp status the name of the function equals and then double quotes less than 30k and close your quotes enter and shift tab we’re almost done we have two more lines now we’re going to type else just else not else if space msrp status the name of the function again equals and then double quotes greater than or equal to 30 k and close your double quotes enter and we need an end if statement so end if and press enter one more time so you get that blank line between end if and in function so if the msrp is less than 20 000 it will display the tax less than 20k if it’s less than 30 000 meaning it’s not less than 20 000 but it’s less than thirty thousand it is say less than thirty k to display that text if neither of those statements are true if it’s not less than twenty thousand and it’s not less than thirty thousand it’s going to just display greater than or equal to 30k so the else statement and notice when you got to the end of the line it put that colon after else you didn’t have to type that so there’s a line editor every time you get to the end of the line it’s checking the line to make sure it’s okay so this is known as an if construct it’s going to do different things depending on whether a statement is true and that’s how you create the function procedure now we should go ahead and compile our project so again you just need to be anywhere between function and in function and do your compile project make sure there’s no errors and then we’re going to save so there are two ways to execute a function procedure the first way is by using what’s called the immediate window and it’s really testing the function to make sure that it works properly and so we’re going to do that way first and then i’ll tell you about the second way which is really super cool in my opinion um and you’ll see that soon so the first thing we need to do is get the immediate window open in visual basic editor so we’re gonna go to the view menu and we’re going to choose immediate window and it opens in the bottom of the screen in the immediate window we can test this function procedure i’ll explain it after we type it in you’re going to type question mark and then msrp status the name of the function and then in parentheses now if you notice right underneath where we’re typing in the immediate window right right underneath that it’s showing that in the parentheses it’s waiting for us to give it a argument so we use msrp in the parentheses as a parameter and now we have to pass it an argument in order for the function to work which means we have to give it a number that represents an msrp in the parentheses we’re going to just type 10 000 no punctuation close the parentheses and press enter question mark means the same as print in vb a right so it’s saying print the result right there in the immediate window so if we look at our if block we said if it’s less than 20 000 we want it to say less than 20k and that’s exactly what it did now we can use either the question mark or the print keyword to the same effect in the immediate window so now in the immediate window you’re going to type print and then msrp status open paren and we’re going to put 20 000 in there and close the parentheses and now press enter so it’s giving us less than thirty thousand so question mark and the print keyword do the same exact thing in the immediate window we’re testing our function to make sure that it works so let’s do another one we could do either question mark or print whichever your preferred one is and we’re going to set it up again msrp status and this time in the parentheses we’re going to put 40 000 close the parentheses press enter and we should get the greater than or equal to 30k the else statement is working because it’s not less than 20 thousand it’s not less than thirty thousand the parameter that we gave it the argument that we gave it in the parentheses it’s forty thousand so we’re getting greater than or equal to thirty k if you’re creating super complicated function procedures you would want to test them in your immediate window giving it different values to make sure it works the other way to test it let’s go ahead and switch over to excel i’m doing alt f11 there okay and let’s go to the inventory sheet tab and click in cell i to and so i2 you’re going to type an equal sign like you would for any built-in excel function and then you’re going to start typing the name of the function we’re going to type ms and our msrp status function shows up here it’s a user defined function in the excel application once you create it unless you go and delete that function you will be able to use it in excel we’re going to click on or since msrp is already selected i’m going to just tab key it’s called tabbing it in and then we are going to click on cell h2 the very first msrp and we don’t even have to type the closing parentheses here because we’re doing it in excel application so go ahead and press enter and then click on i2 and the little notch in the lower right hand corner of the cell is known as the fill handle and once i put my mouse on top of the fill handle it looks like a thin black cross and i am going to double click so you’ll notice it’ll fill it all the way down to the bottom until it runs into a blank right so if i do control n it filled it all the way down to row 105. and it’s looking at each msrp’s value and determining what to display in the adjoining cell and so we are going to right click on the column i column heading and delete that column and i want to show you something else since we’re in here go to the formulas tab on your ribbon and the first button is insert function click it where it says or select a category most recently used do the drop down arrow and you might have to scroll down to see it but you’re looking for a category called user defined now there’s going to be stuff in here that you’re like what does that mean don’t worry about it this stuff that comes into excel automatically but you’ll see your msrp status in that list so that is a user defined function in the excel application which i think is just pretty cool we can just cancel out of that and go ahead and save your file so our last topic in this lesson is getting context sensitive help in the visual basic editor so i’m going to do alt f11 and switch back over to vbe and in vbe i’m still in my mod function module i’m going to just click anywhere in the word function at the beginning of that function procedure and i’m going to press f1 on my keyboard so it brings up the context help box because you’re in excel visual basic for applications and it’s saying that there’s an object in both visual basic and excel called function we’re interested in the vba function so we can just either double click it or go over and click on help it’s already selected so it launches your browser and i can tell you that the vba documentation from microsoft is awesome so it gives you the function statement from vba it lets you know that it declares the name arguments and code that form the body of a function procedure it gives you the syntax so you know just like sub procedures there’s different statements public private right if it’s undeclared it’s public um there’s also friend and static and then the function name and then in parentheses the argument list and you can give it a data type as its return as well which we didn’t have to do on hours right um there’s also an exit function statement that we didn’t need to use so it gives you the breakdown about everything descriptions on everything right and so and then there’s remarks at the bottom and so it says there’s one line in here that says all execute all executable code must be in procedures you can’t define a function procedure inside of another function sub or property procedure and notice that sub there is a link so if i click on that link it brings me to context sensitive help about the sub statement and the other thing i’ll point out in here is on the left side it lets you know that you’re looking at the sub statement right so if i scroll up on the left side there’s the if then else construct and again we’re going to do a deeper dive into that later but if i wanted more information on that i can just click on it on the left side right and it gives you all the information you need to know about that if i continue to scroll up it’s all under the heading statements which is under the heading reference which is under the heading language reference so anything you need to know i’m going to just switch back over to my visual basic editor you can access it by pressing f1 when you are on a particular keyword right so it works that way it gets you into the microsoft documentation really good context specific help at your fingertips so we covered a lot in lesson three and just to recap what we covered we went into a deeper dive about the types of modules that are available within visual basic and the types of procedures then we went on to creating a standard module we created a sub procedure and we called procedures by creating a calling procedure you also learned about the scope of procedures then we created a function procedure and we tested it using the immediate window before going into excel and accessing it in its interface as a user defined function after that you were shown how to get context sensitive help from within the visual basic editor thank you for attending excel 2019 visual basic for applications video course hi everyone i’m trish connor cato welcome to the excel 2019 visual basic for applications video course this course is for beginning users looking to automate repetitive and recurring tasks in microsoft excel vba is microsoft’s programming language and it’s built into the office applications our focus during this course is on excel specifically you’ll be equipped with the basics to start writing your own vba code modify the code behind macros you’ve already recorded and have an understanding of how vba lends itself to creating efficiency in your daily tasks a key component of vba is its language elements you’ll learn about this important topic by learning about variables their scope and how to declare them you’ll also gain an understanding of vba data types intrinsic functions and the with end with structure and how it provides efficiency in your code you’ll also learn to create message boxes and input boxes in this lesson as well as gaining understanding of object variables the next lesson will teach you how to control program flow through supported control of flow structures this lesson begins with an overview of structures and boolean expressions you’ll then learn how to utilize conditional branching and the lesson ends with learning about how to use looping constructs if you’re enjoying these videos please like and subscribe if you want to earn certificates and digital badges please become a member of our patreon the link is in our video description if you have any questions you want answered by one of our instructors please join our off-site community the link is in the description as well as always if this course has exercise files you’ll find them in the video description below in our fourth lesson we’re going to dive into expressions variables and intrinsic functions you’ve already experienced comments seeing them when we fill out the description in the record macro dialog box and we’ve actually modified comments and added our own comments to code that we created from scratch and comments are known as a foundational vba language element well there are others and we’re going to get into them in this lesson so we’re going to get started by learning and understanding variables we’ll go over vba data types and intrinsic functions which include expressions we saw the with end with structure in the first macro we recorded the add formatting macro it created that structure with everything that resides in the paragraph group on the home tab of the excel ribbon and we deleted a lot of extraneous lines just to make our code more concise you’re going to learn about the offset property using message boxes and input boxes and object variables we’re going to be using our regular vehicles macro enabled file as well as two other excel files that are in the video description and you should be putting these files all in the same directory so we’re going to be using an excel file named then numbers and another one called sales fiscal year variables are often considered the most important vba language element since one of vba’s main purposes is to manipulate data variables store data in your computer’s memory when procedures are executed and the data may or may not end up on disk some data resides in objects like worksheet ranges other data is stored in variables you create data that is stored in a variable usually changes while your procedure executes there are of course naming rules and conventions when it comes to variables very similar to the rules and conventions or the rules for naming procedures variable names can be up to 255 characters alphanumeric the first character must be a letter cannot use spaces or any of the characters listed on the slide and then it has another one that is not a procedure rule vba is not case sensitive but it is case preservative so you’ll learn about declaring variables in a moment and you’ll see this play out when you declare a variable if you declare it in proper case right using the rules and conventions and then let’s say the next time you reference it you type it in all lowercase visual basic editor gonna automatically change it to the case it was when you declared it and that’s what case preservative is a convention is used proper case for each word within the name of the variable and we have a couple of examples today’s date then num before you can use variables they need to be declared and just like procedures variables also have a scope so there are two declaration methods they’re implicit and explicit implicit declaration means you declare the variable by just using it without writing a declaration statement and this method can lead to code errors so for example with implicit declaration let’s say i name a variable green for example and then when i go to use it i misspell green it’s going to think that i’m implicitly declaring another variable and you can see how that could lead to coding errors explicit declaration is the preferred method you write a declaration statement to officially declare the variable now when it comes to variable scope you can use either the dim or the private keyword they mean the same thing they’re used interchangeably they have the same result i typically use dim and you declared a variable at the top of the module before the first procedure and that area at the top of the module is known as the declaration section if you want the variable available to all procedures in a module you would use dim or private and declare it in the declaration section the public keyword is also used in the declaration section at the top of the module and you use it if you want the variable available to all procedures in all modules and then there’s a static keyword static variables retain their value even when the procedure ends and you declare a static variable at the procedure level it means it’s only available in that procedure and when you declare variables you should assign them a data type so on this slide it’s talking about the data types that are available in vba and you can see the name of the data type the number of bytes that are used and the data types range of values a byte uses the data type known as a byte uses one byte and has a range of values from 0 to 255 a boolean data type uses 2 bytes and has either true or false as its range of values you have integer long single double currency and then at the bottom you have decimal data type those are your numeric data types they use varying bytes and they have varying ranges of values you have a date data type i don’t think you will ever be in a situation where you’re not covered as concerns a date i mean it goes back to the year 100 and all the way up to the year 99.99 you have your string data types fixed length and variable length and you have a variant data type so if you declare a variable and you don’t assign it a data type it will automatically assign it the variant data type look how many bytes that’s using if it’s a value it’s going to use 16 bytes and if it’s a string it’s going to use 22 plus bytes so you want to be careful and really try your hardest to assign data types when you’re declaring variables i’ve gone ahead and opened the vin numbers excel file that was in the video description and i still have my vehicles macro enabled file open but our focus right now is going to be on this file so it only has one sheet it has one then number and it has several other columns year make model color country classification what we’re going to do is insert a new module create a sub procedure and declare six procedure level string variables we talked about the declaration section at the top of the module window and anything you declare there depending on the keyword that you’re using determines the scope of the variable and the scope of a variable not only determines where it can be used but also affects the circumstances in which the variable is removed from memory only procedure level variables that are declared using the dim keyword are removed from memory when its code has completed execution if you use the static keyword in a variable that’s declared at the procedure level that means it’s going to retain the value of the variable after it executes so you’ll see what this means and how we’re going to use it when we switch over to vbe which we’re going to do right now by doing alt f11 so i want to point out a few things to you now since i still and you do too have the vehicles file open there’s a vba project that we’ve been working in this whole time for that particular file i’m going to collapse that project because we have another open workbook we have another vba project and it’s thennumbers.xlsx file that we just opened one thing i want to point out at the very top of the screen and i’m going to just select like sheet one in here to get rid of the code that’s on my screen and at the very top of the screen we have that option explicit statement this is when it’s time to learn why that’s sitting there and what it means so let’s go to the tools menu and go into options like we did earlier in the course and one of the options under code settings on the editor tab is require variable declaration and that way we can’t do an implicit declaration we have to do an explicit declaration the implicit ones are where you don’t write a declaration statement you just use the variable but that’s the type that can lead to code errors so to get the system to force you to write declaration statements you want this setting to be checked in your options require variable declaration and that means that it produces i’m going to just cancel out of options it forces that option explicit statement to show at the top so it’s going to force you to do variable declaration the other thing we talked about just a moment ago is that the scope of a variable determines not only where it can be used but the circumstances in which the variable is removed from memory you can always use two techniques to remove all variables from memory one of them is the reset button on the vbe toolbar so it looks like a stop button when you hover over it it says reset and a lot of times if you get cold errors once you resolve the errors you’re going to want to reset anyway if you ever get a runtime error there’s a dialog box that will pop up and it has an end button on it if you click end it will remove all variables from memory so i’ve closed the immediate window as we won’t be using it it has an x in its upper right hand corner just to give me some more working space here and what we want to do we’re going to take this in little steps like i said we’re going to set up the framework of a sub procedure and we’re going to declare six string variables we are going to look up at the top of your screen right underneath the option explicit statement is known as the declaration areas that’s why it says declarations over to the right in the procedure box we are going to first insert a new module so we’re going to use make sure you’re on your vba project then numbers right we want to be on that one we’re going to go up to insert module so it gives us a module 1 which we are currently in and again i always verify in the title bar up at the top what file or what project i’m in and then what module i’m in and this is where we’re going to create a sub procedure we are going to type sub and we’re going to name it parse then since then is all capitalized i’m going to leave it that way parse then i’m going to press enter twice and press the tab key so it gave me my parentheses and my end sub statement i’m going to actually and actually we don’t have to press tab i’m going to shift tab i’m going to declare procedure level variables but first i want to type a comment so i’m going to do an apostrophe and type this procedure will parse the vin number into the appropriate columns and then i’m going to press enter and enter again so i have my comment line now we’re going to use the dim keyword so i’m going to type dim and i want to show you two examples here again you want your code to be as concise as possible so you guys you don’t have to type or do anything other than watch my screen just want to show you an example here so hopefully this example is going to show you how to make your code more concise i’m going to highlight the lines of interest here these variables are all using the string data type and i typed a separate line item using the dem keyword for each item why would i do that if they’re all the same data type i can type this line just using the dem keyword once separating the variable names by commas and at the very end giving it the as string data type so that’s the line that you’re going to end up typing and then i’m going to end up keeping but i have another example let’s say you were only declaring two variables and they had different data types so in that case you would end up with two lines dim dealer cost as single dim then number as string the ones that have the same data type i grouped them together on one line easier to type easier to troubleshoot so i am going to go ahead and delete these individual rows of variable declarations and i’m going to delete the last two and we want to declare six procedure level string variables and you’re going to type this dim statement that i have on my screen and you’ll notice that when you get to the as keyword and you start typing string a list of data types will appear so it’s not going to let you type in a data type that you just make up or pull from thin air that is not compatible with vva now that we have our six procedure level string variables declared and again they’re only going to be available to the procedure within which they’re declared we are going to look at building intrinsic functions so by definition they’re functions that are provided by the application like a function procedure an intrinsic function performs a specific task or calculation and returns a value you may be familiar with the three functions we’re going to use in this section because they’re essentially excel functions and there are string functions in excel so if you’ve ever used any of the excel text functions these may be familiar to you we’re going to use left mid and right so the left function extracts specified text from the left of the text string its syntax is left and then you have to tell it what string expression and then you give it a numeric expression don’t worry about memorizing this i will walk you through it when we’re ready to go back to visual basic editor the mid function extracts specified text from the middle of a string it has three arguments well first you use mid which is the name of the function and then it has a string expression that it needs to reference a starting position in that string and the number of characters you want extracted and then the right function does the opposite of the left it extracts specified text from the right of the text string it too has the same arguments as left so right and then the string expression that it’s referencing and a numeric expression that references how many characters are going to be extracted and again don’t worry about this i will guide you through these functions and now i want to show you just a split screen of a slide on the right and the vin numbers excel sheet on the left i mentioned earlier that these are just make believe then numbers but the way we’re using them in this course and the way we’re going to use them in this procedure that we’re developing is based on the slide so we’re saying the first character in the then so in this case the number one represents the country of origin honestly i don’t know if that’s true or not just make believe data here but this is how we’re using it the second character of the then would represent the make the third and the fourth characters would represent the model the 11th character would represent the year 12th character would represent the color and the 17th character of the then would represent the classification again i will guide you through this as we’re using our left right and mid functions but you have the slide for future reference if you want to kind of run through it again on your own you’ll know how we’re using the vin number now we’re ready to use our intrinsic functions in this parse then procedure we already created a blank line underneath our variable declaration dim statement in this procedure and we’re going to press tab on the keyboard to indent and what we’re going to type is range and then in parentheses and double quotes a 2 close your double quotes close the parentheses we’re going to use our dot notation and now you’ll see the list pop up with methods properties bunch of different things we’re gonna start typing select and when it shows up on the list and it’s highlighted i can stop typing and press my tab key to get it in and i’m going to press enter so it’s going to select cell a2 and then we’re going to reference one of our variables but we’re going to reference it in all lower case so we’re just going to type then num and then a spacebar equals and we’re going to type active cell dot and when the list comes up start typing value when i see it on the list i highlight it and tab it in so we’re saying select cell a2 and then that is the active cell once it’s selected we want the then number variable to be populated with whatever is in cell a2 so in excel you can see that the only then number in this file is in cell a2 so it’s going to select that cell and then assign the then num variable that then number go ahead and press enter at the end of that line and notice that it adjusted the casing on venn num remember vba is not case sensitive it’s case preservative so when we declared that variable we did uppercase v uppercase n and then when we typed it in we did it in all lower case as soon as we press enter at the end of that line it goes back and preserves its original declaration case that is an example of case preservative so now we’re going to type year so we’re going in the order of the way we declared the variables that’s easy to keep yourself organized so we started with select cell a2 and then populate the then num variable with the then number that is in cell a2 now we’re going to say what to populate the year variable with so we type year equal and then we’re going to type the mid intrinsic function open paren so right underneath it it’s telling you the arguments that it’s looking for so you’ll see that yellow banner there right right now it’s waiting for the string argument and then you have a numeric argument right and the string argument is bold because that’s the one that it’s waiting for in the open parentheses we’re going to type then num the name of our variable and again doesn’t matter how you do the casing because it’s case preservative then num comma 11 comma 1. so the mid function has three arguments the string argument the start as long argument right that’s the starting position and then the last argument is the number of characters so we’re saying the year is going to equal the 11th character of the then we’re saying in that then num variable which now holds the entire vin number we want you to go to the 11th character and extract one character which is the 11th character you’re gonna type a closing paren so the 11th character of the then represents the year and press enter our next one that we’re going to do is the make because we’re doing them in order here so instead of you watching me continue to type i finish this part of this procedure so we left off with doing the year so i’d like you to just copy from my screen and assign values based on the character or characters in the then to make model color and classification you can pause the video until you get it done and once you have the other variable assignments done go ahead and compile your vba project so just be anywhere between sub and in sub make sure there’s no errors by the way if you just watch my screen i’m going to take out this classification line and i just want to show you something you don’t have to worry about spacing you know the variable is a case preservative so i could type that line as classification no space equal mid open paren i’m typing then num in a weird mix of capitalization 17 comma 1 and i’m not typing spaces at all i’ll type the closing parentheses and when i press enter it gives me the appropriate spacing and it case preserved the name of the variable so you don’t have to worry about your spacing there’s a line editor so when you get to the end of the line and you press enter it will fix little stuff like that for you so you don’t have to worry about that now for the classification since we have 17 character then 17 characters total in the then we could have used the right function it would have just been right then num 17 right the last character but you can also use mid there same result now we’re going to go ahead and i’m going to compile again since i made a change and it’s saying the variable is not defined so i got a compile error this time class because i misspelled classification so it’s not defined i spelled classification and it’s like uh nope sorry you have explicit variable declaration turned on and you did not declare that variable so i’m going to just do ok correct my typo i’m going to compile again and now i don’t get the error we’re gonna test this at this point so we’re gonna switch over to excel i’m gonna use the excel icon on the toolbar to switch over since i have multiple files open and we’re going to test this we’re going to go alt f8 to open up our macros dialog box and we’ll see the macros that are in the vehicles macro enabled file that we still have open as well as this one that’s not prefaced by a file name parsfin because it’s in the current file that we’re working in so i’m going to just click on parsed then i double clicked it and absolutely nothing happened i wanted to show it to you at this stage let’s switch back over alt f11 and switch back over to our parseven sub procedure so all we’ve done at this point in this procedure is declare variables and use our intrinsic functions to assign each variable a value but we haven’t told it what to do with the values assigned to the variable so nothing happened it assigned the values to the variable but we didn’t say how to display those values in order to tell it where to display the values of the variables on the spreadsheet we’re going to take a look at the width end width structure and the offset property and then we’re going to go and complete that parseven sub procedure compare these two code blocks so the top one these four lines selection dot starts at the end of each line it’s repetitive and then you have whatever the thing is so selection dot horizontal alignment equals excel center selection dot vertical alignment equals excel center selection dot wrap text equals true selection dot merge cells equals false so you’re repeating the selection and the dot on every line as a compared to the with end with block of code so you say with selection and then you just do the dot and the thing that it is and what it equals and at the end of it you have an end with statement so with end with structure saves you some typing makes your code a bit more concise and that’s one thing that we’re going to use and then you’re going to learn how to use the offset property it allows you to refer to a cell that is a specific number of rows and or columns away from another cell so it has a syntax dot offset it is a property and then you have the number of rows comma the number of columns as arguments both arguments are not required if you use the rows argument only close the parentheses after it if you use only the columns argument use a comma as a placeholder for the rows argument when positive numbers are used in arguments the property goes down rows and right across columns when negative numbers are used in its arguments the property goes up rows and left across columns so i have some examples here range a1 so if you’re in cell a1 right dot offset one comma two refers to cell c2 the first argument is the rose argument so it’s saying go down one row and go to the right two columns so if i’m in cell a1 and i go down one row i’m in row two and if i go across two columns i’m in column c so it refers to cell c2 if i’m in cell c2 and i do an offset of negative 1 for the rows argument and negative 2 for the columns argument it’s going to go up rows because we’re using negative numbers there and it’s going to go to the left of cross column so it’s going to refer to cell a1 i have range a1 offset 1 and that refers to cell a2 i’m just using the first argument the rows argument so it’s just going down one row it’s staying in the same column no column offset and then the last example there range a1 offset comma two so we’re not using the rows argument but we need a comma as a placeholder or we’ll get an error message and we’re saying go to the right two columns but stay in the same row so that refers to cell c1 and again this powerpoint is in the video description for future reference and i already gave you the typing tips that are on the bottom of the slide so now we’re going to add our width and width structure and include it and it will be our offset statements we’re going to click at the end of the classification line and press enter and then tab and we’re going to type with active cell enter tab again and type dot and the letter o so the offset property shows at the top of the list notice it’s a property you can tell by the icons over time you’ll learn the different icons in the list but the one that looks like offset it looks like a spreadsheet or a piece of paper that a hand is holding that indicates it’s a property if you look down at the green icon that’s in the list for parse and paste special those are methods so just visual cues for you since offset is selected i’m going to tab it in so i don’t have to type and then i’m going to do an open paren comma because we’re not going to use the row offset but we have to use that comma as a placeholder we’re only doing column offsets here one close the paren dot value and you’ll see value on your list so you can double click it or tab it in equal year it’s saying the active cell is still cell a2 up at the very beginning we said select that cell and then we assign the then number variable the vennum variable the value of cell a2 where the actual then number resides that is still our active cell so we’re saying starting with cell a2 offset one column so go to b2 and put in the value of the year variable which is the 11th character of the then now again you don’t have to watch me type i’m gonna just pause and get the rest of these offset lines in and then you’ll be able to pause your video and type them in so after the year offset line you’re going to type the other remaining five offset lines on my screen for make model color country and classification but you’re also going to have to type the end with statement unlike when we do a sub or a function procedure when we type sub parsevin and press enter it gives us the open and closing parentheses for our parameters if any and it gives us the in sub statement or if it’s a function procedure the end function statement it will not give you the end with statement that is required with the with end with constructs so make sure you out dent and get your end within and you can go ahead and pause the video and get those lines typed in and once you’re done you’re going to go ahead and compile your project check to make sure there are no errors and we’re going to switch back over to excel i’m using the icon on the toolbar to get there and so now we’re ready to test it we told it what values to assign to each variable and now we’ve told it where to display those variable values which column and cell to display it in by using our offset statements within the with end width structure so i’m going to just be on any cell in here and i’m going to do alt f8 to bring up our macros dialog box and i’m going to click on parse then and then run or you can double click it and i’m like yay it worked it put the right bits of data in the right cells except for country what happened to country stay tuned and we’ll take a look and you’ll find out just so you know i did this on purpose you can blame me but i did it on purpose because a lot of coding is troubleshooting and we get to debugging code in like the last chapter of the last lesson of this course but along the way you’re going to run into situations and it’s helpful to get some guidance in what to do so in this case everything worked except it didn’t populate country in row two so the first thing we’re going to do since it didn’t work the way it’s designed to work is we’re going to delete we’re going to select b through g2 and just press delete and we’re going to switch back over to the visual basic editor so the last thing we did was our with endless structure and i’m going to start there and i look through the list and our offset statements pardon my ocd but i have them in order one two three four five six again i don’t want to be looking up and down if i’m troubleshooting to figure out where something is but i do have an offset statement for country so i’m like okay it’s not that the compiler did not pick up any errors so it’s something that i probably missed so i look up in the upper half of this and i said you know we’re going to tackle these variables in their order so we started with then num then we went to year make model color and then we skipped country and went to classification so we never did our country intrinsic function to tell it what value to assign to that variable which means that it can’t display anything even though we did an offset statement i’m going to click after the color mid function line and press enter so it’s in order the first character of the then represents the country so we’re going to use the left intrinsic function here we’re going to type country equals left open paren then num and we want it to extract one character which is the first character from the left side of the then number and we’re gonna close our parentheses we’re gonna press enter just so it does any formatting and then i’m gonna delete that extra line and shift tab so classification we’re going to go ahead and compile our project again make sure there’s no errors and now we’re going to switch back over to excel we’re going to do alt f8 to access our macros box and we’re going to run parse then again and now you’ll see that the year make model color country and classification columns are filled in appropriately as a result of the parse then procedure so because we created a sub procedure in this file you probably want to go ahead and save it as macro enabled workbook and i’m going to let you go ahead and do that on your own and when you’re done and you look in your working directory you have two vehicles file one is just a regular excel file and the other is macro enabled and now you have two vin numbers you have your regular one that we started with and then the macro enabled one that you just saved now we’re going to begin to get some background information on both the message box function and the input box functions in visual basic so we’re going to start with the message box function on the slide it has the syntax so in parentheses you have a prompt which is required and then you have two optional arguments buttons and title the message box function displays a pop-up box with a message for the user another thing vba will allow you to use the function without enclosing the arguments in parentheses a best practice here is to always enclose function arguments in parentheses so you err on the side of caution and to provide consistency in your code now if you do not use the title argument the title defaults to the name of the application which in this case is excel microsoft excel so the table on the right tells you about the argument it displays text in a message box for the end user the buttons is a number that specifies which buttons and icons appear in the message box this is optional if it’s not used the message box will default to the ok button and then you have the title argument like i said if you don’t use the title argument it defaults to the name of the application but if you want it to say something else in the title bar of the message box then you would use this argument to choose which buttons and or icons display in your message box you do that by using what are known as vba constants constants are similar to variables they are declared however while variable values can change during program execution constant values do not change and visual basic for applications constant names are preceded by lowercase vb so you have a table on the right we’re not going to review this again the slide deck is in your video description files and you can use it for future reference but if you just want an ok button in your message box the value for that particular constant is zero if you wanted a question mark icon in your message box you would use the value of 32 to represent that in addition to referencing the icons and the buttons in the message box by utilizing the values as we saw in the previous slide you can just use the vb constant name if you say vb yes no plus vb exclamation it will display the yes and no buttons with the exclamation point icon if you have vb ok cancel plus vb critical you’ll get the ok and cancel buttons and the critical warning icon and you can also have multiple lines for the prompt argument by using the vb newline constant so here’s an example msg box that’s the message box function in parentheses in double quotes because it’s text do you want to continue question mark then we’re using the concatenation character the ampersand to combine everything and we’re using the vb new line constant so it’s saying go down to the next line and on the next line it’s going to say click yes to continue then after that so all of that is the prompt argument and then we say vb yes no plus vb question so we want the yes and no buttons and the question mark icon and then the last argument is the title and we’re gonna put in step one of three for a title and when we get back into visual basic editor to use the message box function you’ll use the assignment operator which is the equal sign to assign the return value of a message box button to a variable you’ll see that in a bit and we’re also going to be using the input box function similar syntax to message box has three arguments one of which is required which is the prompt it has a title argument and a default argument and an input box is used to obtain a single piece of information from the user the information could be a value a text string or even a range address input boxes always display ok and cancel buttons so the prompt argument is just like the prompt argument for a message box the title argument is the same as well it’s optional but it’s the text value that appears in the title bar and if you don’t use it it would be the name of the application and then the default argument is new to you here it’s the default argument for the user’s input so it’s optional but you can pre-populate it and if the user doesn’t want what you pre-populated with they can type over it so we’re going to get ready to use both the message box and the input box functions we’ll be working again in our vehicles macro enabled file i’m in the visual basic editor for our vehicles macro enabled file and in the project explorer window i’m going to go ahead and double click sheet 3 new vehicles so this is where we use the event procedure when the new vehicle sheet is activated it runs the get new inventory calling procedure which bundles all the other procedures to retrieve that data and so we’re gonna make this further automated by modifying this procedure here and it’s going to give the end user a choice whether they want to get the new inventory or not so we’re gonna modify this worksheet activate subprocedure and click right in front of where it says get new inventory and press enter a few times and then use your up arrow to go back up so we want that blank line after private sub worksheet activate again just for spacing purposes and when you have to debug your code it’s easier to read so what we’re going to do is we’re going to declare a variable and it’s a procedure level variable so it’ll only be available in this sub procedure so we’re going to use our dem keyword and we’re going to name the variable response and we’re going to declare it as an integer and then i’m going to press enter and this is how you assign the user input from a message box results to a variable our next line is going to do just that we’re going to type response equals remember the equal sign is the assignment operator and then we’re going to type msg box we want to use our line continuation character here we’re going to do a space and then an underscore and press enter and remember if we didn’t do that and we just press enter we’d get an error because it’s expecting the rest of the message box arguments the rest of its syntax rather on the same line unless we tell it to continue to on the next line so that’s what we’ve done here and then we’re going to tab again and we’re going to do an open paren double quotes do you want to run the get new inventory procedure question mark closing double quote comma so that’s our prompt argument and your arguments separated by commas now we want another line continuation so we’re going to do a space and an underscore and enter we’re ready for what combination of buttons we want in the message box as well as which icon so we’re going to type we’re going to use the constant names vb yes no plus vb question comma and for our title bar argument our title argument it’s going to be in double quotes run get new inventory and i’m going to put a question mark at the end of that and close the quotes and now we’re ready to our closing parentheses now we’re going to press enter and we’re going to shift tab to get back to the margin so so far we’ve declared a variable response as an integer and we’re saying response equals whatever the user choices are in the message box well we have to tell it what to do based on a user choice so now we’re going to type if and then response equals vb yes then and now i’m going to use my delete key to get the get new inventory line on that same line if the response equals yes so if there’s going to be a yes and a no button in the message box if the response equals yes then run the procedure and we’re not telling it what to do if they say no in the message box so if they say no it’s not going to do anything in other words it’s not going to run the procedure go ahead and compile your project make sure there’s no errors there and let’s go ahead and save so now we’re ready to test this messagebox function and i’m going to just do alt f11 to switch back over to excel or any way you want to get there is fine and we’re going to click on the new vehicle sheet tab and let’s just say no at this point right so this time when we click on it instead of just running the procedure it gives us our message box let’s say no on the message box and it doesn’t bring in any of the new vehicle information go back to your inventory sheet tab click on new vehicles again and now you’ll see your title bar run get new inventory you see it has the question mark icon in the message box and it has yes and no buttons so we’re gonna click yes this time and it ran the procedure and we’re gonna select everything by doing control a and pressing delete and then just clicking cell a1 on new vehicle sheet again and go back to your inventory sheet now we’re going to switch back over to visual basic we’re going to use the input box function in our next example so we want to in visual basic editor we want to go to our new vehicles module and we’re going to modify this get new vehicles sub procedure the scenario here is that it defaults to opening that received vehicles file right and copying and pasting the information from it so suppose that that file changes over time maybe this month it’s called received vehicles maybe next month it’s called something else we want to give the users the end user the ability to put in what the actual file name is most of the time it will be received vehicles so we’re going to use that as a default setting that the user can override as necessary so the first thing we’re going to do is we’re going to go ahead and update the comment line so i’m going to just select that first comment line that says get new vehicles macro i’m going to leave the exclamation point there though so it will retain its status as a comment line and i’m going to type prompts the user for the name of a file comma opens the file comma selects the data and the second comment line the copy and paste data we’re going to just say copy and paste data into the current workbook so it’s going to be a more accurate description than what it was before underneath i’m going to press enter a couple of times and now i’m ready to declare two procedure level variables they’re both going to be strings so we’re going to do dim file location comma file as string so our two string variables and now i’m gonna click in front of workbooks dot open file name and press enter a few times and then i’m gonna up arrow so i have a blank space after our variable declarations and i’m gonna type file location equals this workbook dot path the directory path to this particular workbook this vehicle’s workbook so we’re assigning that path to the variable file location i’m going to press enter and now we’re going to say file equals and we’re going to type input box open paren double quotes what is the name of the new vehicles file question mark double quote comma and we want our line continuation character here so space and underscore and enter now we’re going to tab in one time and now we’re ready for the title argument so that is the prompt argument what is the name of the new vehicles file now we’re ready for the title argument and it’s going to be in double quotes new vehicles file name question mark close your quote comma line continuation so your space underscore enter and our last argument here for input box is the default argument so the actual text box in the input box will be populated with and we’re going to put it in double quotes received vehicles and you have to have the extension dot xlsx close your quotes closing paren enter we’re almost done with this one and we’re going to do shift tab just to get to the same margin as file location and file and we’re going to type file equals file location the ampersand for our concatenation character and then in double quotes a backslash another ampersand and file so we’re saying that the file location is the path on your directory path to this workbook the vehicle’s workbook and the file variable is going to be the result of the user’s input box choice if they keep the default it will be received vehicles.xlsx if they over type that it’d be whatever they over type it with and then we’re saying we want to combine the file location and the file with a backslash in between the file location and the file name and that is then going to be what the variable file represents and this is assuming that the received vehicles file or whatever file has the new inventory in it is in the same directory path as this workbook we have one other change to make to the existing code that was here so i’m going to go underneath my file equal file location concatenated line and i’m going to just delete the blank lines that are there and now we’re going to change that workbooks.open file name line so what i’m going to do is after the equal sign at the end of that line i’m gonna type file and then we’re gonna delete the continuation character notice how we get that red line underneath because we don’t have we’re not telling it to continue on the next line and we’re going to delete that whole path there because now we’re saying open the file based on the variable file so file is now the file location path and whatever file is in not name is in the input box whether it’s received vehicles or whether the end user types in something else so we don’t need the rest of that stuff that we had there go ahead and compile your project and save so now we’re going to be ready to test this and i will say we’ve given now the end user the ability to say no or yes that they want to run the get new inventory procedure and now the additional use of being able to dictate which file to bring the data into from i’m going to just go over to my excel and i’m on the inventory sheet tab i’m going to click on new vehicles and there’s our message box and we’re going to say yes that we do want to run the get new inventory procedure and now we see our input box we point out the title argument new vehicles file name question mark right here is our prompt what is the name of the new vehicle’s file and then we have our default argument where it populates it with receive vehicles.xlsx and it can be overwritten by the end user we’re gonna click ok to accept the default and it runs the procedure and of course we are going to select everything and delete it actually go back to your inventory sheet tab the last part of this lesson is getting used to object variables so they’re used to make your code more concise they help you avoid typing lengthy object references and when you’re declaring object variables the scope statements you use with regular variables are applicable so your dem private public keywords are the same object variables are declared with object types instead of data types so we have the syntax there you could use dim public private static the name of the variable as the object type so examples would be public sheet as worksheet dim range as range when you assign values to object variables you have to use the set keyword so your basic syntax would be set variable name equal object name set sheet equal worksheets year-to-date sales set range equal activesheet. a1 through f12 once you assign an object to an object variable the object can be referenced by its variable name now we’re going to do exercises obviously using object variables and we’re going to be using the sales fiscal year dot excel sx excel workbook in your directory it was a file from your video description so in this excel file we have multiple sheet tabs if i just right click on your tab scrolling arrows you’ll see going from june 1st 2016 to august 26 2016. each sheet is representing sales on that day so you have your vins your year make model classification color dealer costs msrp selling price and the sales person each sheet has different amounts of data so different amounts of rows of data depending on the sales on that particular date we’re going to use object variables and we’re going to create a sub procedure that will sum the column column i the selling price column and place the result in the cell two rows below the last populated cell in that column so for example on the 26th of august sheet we want the selling price sum to be two rows underneath the last selling price in column i and we’re going to use object variables to set that up let’s go ahead and switch over to the visual basic editor and make sure you’re in the right project if you still have your vehicles file open you may not see it here if you don’t see your file your sales fiscal year file listed over here sometimes you have to close the visual basic editor like mine’s been open the whole time so i’m going to close it and then go back into it just a little trick sometimes it doesn’t refresh and now i can see projects for sales fiscal year which has a lot of microsoft excel objects because of all the sheets i can collapse that and i still have my vehicles project there as well collapse that what we’re want to do in here is start this code where we’re gonna declare object variables so we’re gonna expand our sales fiscal year project and you can collapse your microsoft excel objects folder right click on your sales fiscal year project in project explorer hover over insert and choose module and in module 1 we’re going to start a sub procedure we can just this one’s not going to be very long we can just type it in so we’re going to type sub and we’re naming it add totals and i’m going to press enter twice and then i’m going to tab and i’m going to declare my object variables so we’re going to use the dim keyword and the variable name is going to be last cell as a range so as an object not a data type so we’re dimming last so we’re declaring last cell as a range enter and we’re going to dim total formula as a string and enter so two object variable declarations i’m going to enter again and then tab we’re going to set so we have to use the set keyword when assigning a value to an object variable last cell equals and then range and in parentheses and double quotes we’re going to type i2 so cell reference i2 close your quotes close your parentheses type the dot notation and then end and now when you type an open parenthesis you’ll have a list that pops up and we’re looking for the entry that says excel down that’s an excel constant and we’re going to close the parentheses so that line is saying starting in cell i2 go all the way to the end of that column until you find the last populated cell we’re going to press enter and we’re going to type last cell dot select right so the last populated cell is now selected in column i press enter and we’re going to do active cell dot offset you remember our offset before in parentheses we’re gonna do two close the parentheses so we’re saying the last populated cell is currently selected and we want to go down two rows dot select and select that blank cell two rows down from the last populated cell now we have to tell it what the object variable total formula is going to be so we’re going to do total formula equals in double quotes equal sum open paren i to colon close your double quotes space and an ampersand we’ll get this one typed in and i’ll explain it and then a space last cell dot address which will be on your list open paren false false closing paren space ampersand and then in double quotes a closing paren you’re like what okay so basically it’s saying we have that last cell right selected the last cell object variable is set to the last populated cell so it’s saying give the total formula give me the sum from cell i2 through the last cell address wherever that last populated cell is it could be i24 could be i26 whatever it is and then it wants to know if that last cell address is absolute and we’re saying false it’s not absolute by row it’s not absolute by column and then we just need to enclose it in a parenthesis a literal parenthesis so we have that in double quotes as well and now we just have to assign it so we’re going to go down and we’re gonna type active cell dot formula equals total formula declared to object variables we set both of them well last cell we we said it’s from i to the last populated cell starting in cell i2 and then select that last populated cell offset it by two rows and populate the total formula result in that cell that’s two rows underneath the last populated cell in column i that’s what you just did and we have our in sub statement there and you’re going to go ahead and compile your project and save so when we get to the save part right it lets us know that this is a macro free workbook we could lose our code here so we’re gonna do no on that message box and you’re gonna save it same file name as macro enabled we are going to test this sub procedure in a different way than we’ve seen our procedures run before so normally we’ve been running our procedures and the entire block runs we want to see kind of like the behind the scenes step-by-step version of what happens when we test this add total sub procedure with our object variables so i’ve arranged my windows i have my visual basic editor on one side of my screen and i have the excel sales fiscal year now macro enabled workbook on the other side of my screen so take a moment and get your screens arranged that way and then in the excel portion of your screen you’re gonna do alt f8 to bring up your macro dialog box now i still have my vehicles file open so you’ll see the macros that are in that file the code blocks that are in that file but you also see our add totals code here and so what you’re going to do is you’re going to just click once on add totals and over on the right you’re going to click on step into so now in your visual basic editor you’ll see that the name of the sub procedure is highlighted in yellow and there’s a yellow arrow in the margin so at this point if we were running the procedure it would be at this step it would just be highlighting the sub line of the procedure there’s no change in our excel window at all we used step into from the macro dialog box the shortcut key for step into once it started is just the f8 key on your keyboard so now we’re going to press f8 so it skipped the lines our object variable declarations it skipped those lines and it went to the first line of code so it’s saying set last cell equals range i2 and xl down so we want the last cell to be the last populated cell in column i but notice there’s still no change on your excel workbook at this point press f8 again and now it’s on the last cell select line again you’re not seeing any change in excel let’s f8 again now you’re seeing a change in excel in excel it has now selected the last populated cell in column i so when this active cell dot offset line is yellow highlighted you’ll see the step before it you’re now seeing the results of last cell dot select press f8 again so now you’re seeing the results of active cell offset by two rows so now it’s selected the cell two rows underneath the last populated cell in column i we’re going to f8 again no change in excel because we told it what the total formula is right it’s the sum of from i to the last populated cell in column i at this point we haven’t told it where to put that result so go ahead and press f8 again and you’ll get the result now activecell.formula equals the result of the totalformula object variable so you can see how this can be useful when you have varying amounts of data on different sheets but you want the sum to be two rows underneath the last populated cell in a particular column we’re going to press f8 one more time to finish the procedure so now all your yellow shading is gone in visual basic and on that one sheet the 26th of august sheet we do have the sum of column i’s selling prices in this lesson we did a deeper dive into foundational vba language elements and we started by getting an understanding of variables and you learned that variables store data in your computer’s memory when procedures are executed and the data may or may not end up on disk some data resides in objects like worksheet ranges and other data is stored in the variables that you create and so you learned about the naming conventions when you declare variables how to declare them you learned about the data types that are supported in vba and the importance of assigning data types to the variables you declare so that it uses the least amount of memory on your computer you learned about the scope of variables meaning where they can be accessed from as well as two methods of declaring them which is implicit and explicit and we have the option explicit statement at the top of all of our modules so it forces us to explicitly declare our variables which is the preferred method because implicit declarations can often lead to code errors and so we moved on to covering some intrinsic functions and we used the left mid and right functions to extract data from the then string we learned how to make our code more concise by using the with end with structure it decreases the amount of typing that you have to do and we did that when we used the offset property to put the extracted data into the right cells we moved on to using the messagebox function to give the end user more control over whether a procedure runs or not you learned about visual basic constants which are used to control which buttons display in the message box as well as which icon displays in the message box and then we moved on to input box which gave the end user the ability to change to a different file to get that data brought into the main vehicles file and you saw that it has similar arguments to the message box function but it also has a default argument which we populate it with the name of the file and the end user can overwrite that and then we ended up with declaring object variables and we did that so that we can configure a sum function on a sheet that shows two rows below the last populated cell in a particular column and this is useful when you have sheets with varying lengths of data on it to be able to set up object variables and get the result in the same position relative to the last populated cell in a column so lesson five is about controlling program executions we’re going to start by learning about control of flow structures as well as boolean expressions you’ll learn about conditional branching looping constructs in this lesson as well we’re going to be using our regular vehicles macro enabled sales fiscal year macro enabled files as well as two text files in the video description one is called inventory append and the other is called model to this point we’ve worked with code blocks either the ones that we created via macro recordings or by writing sub and function procedures that progress line by line through the code this is known as a sequential structure there will be situations where a sequential structure is not what you need for your project and we actually got to visually see a sequential structure where we did our object variables and we stepped into the code seeing line by line how it works in the background in vba you use control of flow structures in your code to make decisions such as which statements to skip testing conditions to determine what the code should do next and to execute some statements multiple times you’ve seen a small example of that when we did our message box function where we modified that event procedure with an if then construct so if they did the yes button in the message box it would run the code if they did the no button it would do nothing so you’ve had a small example of that already so here you’re seeing the common control of flow structures you have sequential which we’ve already discussed you have unconditional branching and you’ve seen that already you’re just not aware of it yet and that’s a statement directs the flow of execution to another location in the program without condition so when we created a calling procedure that is unconditional branching you’re going to learn about conditional branching the code to be executed is based on the outcome of an expression that evaluates to true or false a boolean expression and that’s also known as a decision structure and it is used to implement conditional branching and then we have our looping structure which a block of code is executed repeatedly as long as a certain condition exists within the conditional branching and looping structures there are constructs that you use to carry out the job of the structure so we’re going to focus on our conditional branching right now we’ll revisit this slide later to go over our looping structures but within your conditional branching there are two different constructs there’s if then and select case so if then statement does something if something is true your select case statement does any of several things depending on something’s value and we’re going to focus right now on our if then constructs and you also need to know a little bit about boolean expressions here so let’s do that first so boolean expression evaluates to true or false they usually contain two expressions on either side of a comparison operator if the expression evaluates to true the condition is met and the structure passes control to the code to be executed so we have an example here sheets dot count less than three if the count of sheets in the workbook is less than three the expression is true if the sheet count is greater than or equal to 3 the expression is false boolean expression expressions are of the integer data type so they’re stored as 0 for false and negative 1 for true but now we’re going to just briefly go over these comparison operators the ones that i like to know about when i tackle a new programming language is how is not equal to represent it because it varies according to a different programming language so in here it’s less than and equal to symbols together in vba also at the bottom of the slide you use the is keyword to compare object variables and you use the like keyword to compare string expressions in visual basic then you have the logical operators and so you can test for more than one condition by joining boolean expressions with a logical operator we have the table here we have and or not an exclusive or when you’re using the and operator each expression must evaluate to true for the entire condition to be true when you’re using or only one of the expressions must evaluate to true for the condition to be true the not logical operator says the expression must evaluate to false for the condition to be true and then you have exclusive or which returns true if the expressions are different so i have a couple of examples of joined expressions here year greater than 2017 and make equals chevrolet both of those conditions have to be true because it’s using the and keyword in order for the expression to evaluate to true selling price less than or equal to fifteen thousand or list price greater than fifteen thousand only one of those statements has to be true in order for the expression to be true because it’s using the or logical operator the if then construct has four variations that can be used in visual basic for applications so we’ve already seen if then if the condition evaluates to true it executes the code after the then statement if the condition evaluates to false it does nothing the next variation is if then end if it’s the same as if then but it closes the if block with the end if statement and i’ll just let you know now most of the time it needs to be closed with that end if statement or you’ll get an error then you have the if then else end if variation if the condition evaluates to true it will execute the code after the then statement if the condition evaluates to false it will execute the code after the else statement this is the one that’s most similar to the if function in excel in the if function you give it a condition and you tell it what to do if the condition is true and what to do if the condition is false and then we have if then else if end if and by the way you can also have if then else if else end if and this is used to test multiple conditions and it can take an action on any that evaluate to true and again the else statement can be used if all conditions evaluate to false so if condition is true let’s say if condition one is true then it will execute the code after the then statement else if condition two is true right or condition three condition four condition five so the ability to test multiple conditions and say what to do if any of them are true there is another conditional branching structure which we’ll talk about before we use and that’s the select case statement but for right now we’re going to go ahead and use our if then constructs i’m back in the visual basic editor and i’m in the code window for our sheet 3 new vehicles so that event procedure which we already modified to add our if then statement we’re actually going to put in a if then end if statement in here imagine if there’s something already populating cell a1 on your new vehicle sheet if that’s the case if the sheet is already populated you don’t want it to have the message box asking if they want to run the get new inventory procedure because the sheet is already populated only if that cell is empty do we want it to bring up the message box offering the end user the choice to run the procedure so we’re going to create an if statement and let’s click at the end of our dim response as integer line and press enter and i’m actually going to press enter twice and then i’m going to do my tab key and we’re going to start typing this if then end if construct so i’m going to type if and then active sheet dot range and then in parentheses and double quotes a1 for cell a1 and you want to close your quotes and close your parentheses dot value equals and we’re gonna have a set of double quotes which means it’s empty so two double quotes no space in between and then we’re gonna type the then keyword if cell a1 on the new vehicle sheet is empty then right we want it to do response equals message box do you want to run the get new inventory procedure so all of the stuff that we have there and now what we need to do click after that if response equals vbs line press enter and tab and type end if now the other thing we’re going to do is we’re going to click in front of that if response equals vbs line and we’re going to press tab twice we have an if construct nested within an if then end if construct it will only bring up that message box do you want to run the get new inventory procedure if cell a1 on new vehicles is empty let’s go ahead and compile and then save and switch over to excel go to your new vehicle sheet say no you don’t want to run the procedure and just type anything in cell a1 can be number text anything now go back to your inventory sheet and back to new vehicles and you’ll notice that the message box does not pop up because cell a1 is not empty so now you can click on cell a1 and delete that information go back to inventory back to new vehicles and because the sheet is not populated at least so a1 is not populated it displays the message box and we’re going to say no on that message box so now we’re going to create a function procedure and we’re going to do it in our new vehicles module for our vehicles macro enabled file and we’re going to create a function procedure with two arguments this is going to evaluate the character in the then that represents the model year and then mark up the cost based on whether the vehicle is from the current or previous year so the then character is the 11th character in the then so we’re going to use an intrinsic function here within an if then else end if structure so we’re giving it something to do based on two different things right what to do if our condition is true and what to do if it’s false so the 11th character of the then is either populated with an a or a b the a means it’s the previous year in which case it will get a 10 markup the b means it’s the current year and it will get a 15 markup so i’m going to guide you through this now so i’m in mod new vehicles and i did control end to get to the bottom of the module and i’m going to type the name of the function that we’re using here so it’s going to be function and it’s going to be called get msrp and in parentheses we’re going to give it two parameters dealer cost and then num and press enter twice so now you’ll have your function and end function statements and this is where we’re going to now set up the if construct using the mid function so i’m going to tab and i’m going to type if mid open paren then num comma 11 1 so if the 11th character of the then number close your paren equals and then double quotes b then enter and tab get msrp equals dealer cost times 1.15 and then we can put a comment at the end of that line so i’m going to do a single quote and afterwards i’m going to type vehicle is current model year and then press enter so only the comment portion of that line turned green anything after the apostrophe or single quote turns green and it’s just explaining what that math is on that line and that the character b represents the current model year okay so now we have that we’re going to do a shift tab to get back to the same margin as if and we’re going to type else enter tab and we’re going to type get msrp equals dealer cost asterisk for multiplication 1.1 which is 10 percent we’re gonna do a comment a line comment there so your apostrophe and then vehicle is previous model year enter shift tab and you need to type an end if statement here and then i’m going to press enter again so i have that blank line between end if and end function now we’re going to go ahead and compile and save and we’re going to call this function from another procedure so we’re not going to test it quite yet what we’re going to do is we’re going to go to the upper right corner where it says get msrp in your procedure list we’re going to do the drop down arrow there and we’re going to select the get new inventory procedure just to navigate to that procedure in the get new inventory procedure we’re going to declare two local variables so right underneath the comment line i’m gonna at the end of the comment line i’m gonna press enter twice and i’m gonna just declare these two local variables so we’re gonna dim dealer cost as single data type and then the next line we’re gonna dim then number as string data type so we have our variables declared click at the end of the add formatting line and press enter and you’re going to type range and then in parentheses and double quotes a2 dot select so we wanted to select cell a2 and so a2 on the inventory sheet is where the first vin number resides so we want that cell selected and then we’re going to assign the then number variable that cell as its value so the next line down we’re going to do then number equals active cell dot value and enter and now we want to assign the dealer cost value in sell g2 on that sheet to the variable dealer cost so on this line we’re going to type dealer cost equals active cell dot offset so we have to offset it by six columns no rows so it’ll go to g2 where the first dealer costs would be so we’re going to do a comma because we’re not using the row offset and then a 6 close your paren dot value so we’re assigning the value of cell g2 to the dealer cost variable and then we’re going to call on the next line down we’re gonna call the get msrp function and put its result in cell h2 so that line is going to be active cell dot offset in parentheses comma 7 which takes us to h2 and we’re going to do dot value so the value of cell h2 is going to equal and this is how we call the function procedure by its name and its parameters get msrp and then in parentheses dealer cost comma then number let’s go ahead and compile in our get new inventory and save and we’re going to switch over to excel so now we’re going to test this get msrp function by initiating our calling procedure so we’re going to go to the new vehicle sheet and we’re going to say yes that we want to run the procedure we’re going to use the default file name and you’ll notice that the msrp column is not wide enough now right and that is an easy fix so let’s select everything on this sheet and delete it and switch back over to the visual basic editor if you look at our get new inventory sub procedure the ad formatting procedure is being called before we do the get msrp section of this so we just need to move add formatting to right above the end sub statement so i’m going to just select it and cut it and then i’m going to click at the end of the active cell offset line press enter and then i’m going to ctrl v to paste it and get rid of the extra space by doing shift tab in front of it we had add formatting in the wrong position so now to add the formatting at the end after the msrp is already calculated and so now i’m going to compile and save again and switch back over to excel go back to the inventory sheet tab back to new vehicles yes run the procedure keep the default and now you’ll see that the msrp column is populated and formatted accordingly so the column width has been adjusted and everything and again it’s either 10 or 15 percent depending on whether the 11th character is a b or an a in the venn now we can clear the sheet again the new vehicle sheet and we’re going to create another function procedure that will get the year in the appropriate column on the sheet we can just go back to the inventory sheet after you clear it and then switch back over to the visual basic editor window i’m still in my new vehicles module i’m going to click at the end of the end function statement at the bottom for our get msrp function i’m going to press enter twice and we’re going to type function and this one we’re going to name get year and we’re going to give it one parameter and that’s going to be then num press enter a couple of times in this one we want to declare a local variable it’s going to be named year marker with a string data type so i’m going to just do dem year marker as string we’re going to set the value of the year marker variable to the 11th character of the then remember that’s the a or b either indicates the current year or previous year type in year marker equals and then we’re going to use the mid function mid open paren then num comma 11 1 the 11th character the vin number enter and now we’re going to use an if then else end if construct here as well so i’m going to tab over mid and then then num and you can copy and paste this if you want 11 1 equals and then in double quotes a then enter tab get year equals 2018 and then i’m gonna do a shift tab so i can get my else statement at the same margin as the if statement so else enter and then tab get year equals 2019 enter shift tab and end if and i’m going to press enter again so i get that blank line between end if and end function now we have to tell the get new inventory procedure where to place the result of the get year function so in your get new inventory procedure i’m clicking at the end of the line that starts with dealer cost press enter and you’re going to type active cell dot offset and then in parentheses comma 1 dot value equals get year and you have to put in the argument so it’s going to be uh get year we just use vin number and then you can go ahead and compile your get new inventory compile get year if you haven’t it compiles everything in the module actually so you don’t have to compile one and then save and then go ahead and switch over to excel let’s switch back to excel and test our work so at this point we should be getting the msrp and the year extracted from the then let’s go ahead and test this so i’m going to just go back to the new vehicles tab i’m going to run the procedure accept the defaults let it click and were and we have our year in column b and our msrp in column h again we’re going to select everything and delete it go back to your inventory sheet and switch back over to the visual basic editor now we’re going to create another function procedure to extract the classification from the then the classification is the 17th character of the then the last character of the then and depending on what its numeric value is it would either be a classification of a car a truck a van minivan or an suv so we’re going to put that function at the bottom of our new vehicles module and we’re going to just type function get classification is what we’re naming it and we’re going to give it then num as a parameter press enter we’re going to do our function level or procedure level variable declaration so we’re going to do dim class marker is what we’ll name this variable as string enter twice now we have to tell it which character of the then is the classification code we’re going to do that by saying class marker equals we’re going to use the right intrinsic function and then in parentheses then num comma 1. just extract the last character on the right of the vin number which is the 17th character representing the classification now we’re ready to do an if then else if end if construct because we’re going to actually be testing four different things so we’re going to have our test that we do on the if line and then we’re going to have three else if lines so it tests three other things we’ll start that i’m gonna press enter twice and then i’m gonna tab i’m gonna type if class marker equals one then enter and tab get classification equals and then double quotes car enter shift tab now we’re ready for our first of the three else if statements we’re going to do else if is one word initial capital letters on each one in visual basic so else if class marker equals two then enter tab get classification equals and then double quotes truck enter shift tab your next else if else if class marker equals three then enter tab get classification equals and then quotes van slash minivan and do your last else if so if the class marker is four then the classification is suv and you can see my elsa statement for the suv i’m going to press enter and shift tab and then i have to type my end if and you want to make sure you have press enter so you get the blank line between end if and end function now we’re going to navigate and again i’m using the procedure list i want to go back to get new inventory procedure and so we’ve been adding these active cell offset lines to put the year and the msrp in their correct cells right we have one there for dealer cost as well and we want to make this code more concise so we’re going to create a with end with block because we have other things that we’re going to be extracting as well so it’ll make this code more concise i’m going to click at the end of the dealer costs equals line and press enter and i’m going to type with active cell and then on the next line down i’m going to double click active cell before the dot offset and delete it just leaving the dot offset do the same thing on the next line go to the end of the last.offset line press enter and type end with so now you’re gonna go back and click after the dot offset comma one line press enter and we can add the offset here for the classification so we’re going to do dot offset and this one’s going to be comma 4 dot value equals get classification the name of our function and then we’re using then number as the argument here so this way we have the offsets in order so far one four and seven and that makes it easier to troubleshoot now i’m going to press enter at the end of that line just to get the spacing and then i have to delete and shift tab again so now we have our width block set up i’m going to select from with down to end with and press my tab key so that that width end width structure is indented now we can compile and save and switch over to excel and we’re going to test this so at this point we should have the year the classification and the msrp populate when we test this so go ahead and switch over start your procedure except the default and now we have the year the classification and the msrp extracted from the then and we can switch back over to visual basic editor we’ve just used the if then else if end if construct and there is a variation on that a different construct that mimics its use and it’s called the select case in select statement so it also tests for multiple conditions a lot of people think that select case is easier to read than the if then else if end if construct and also easier to troubleshoot so the if then else if end if construct has limitations it can only test like seven conditions but with select case you’re unlimited in the number of conditions that it can test so i have a slide in here giving you the syntax but we’re gonna just go ahead and use it before we set up our first select case construct to extract the color from the vin number i’m going to have you switch back over to excel and select everything on the new vehicle sheet delete it and then go back to the inventory sheet and then come back into visual basic editor i’m at the bottom of the new vehicles module underneath the get classification function and i am going to type function and we’re going to call it get color and we’re going to use then num as a parameter press enter twice we’re going to do a variable declaration here so dim we’re going to name it color marker as string and enter twice we need to tell it which character of the then number represents the color and it’s the 12th character of the vin it’s only one character so we’re going to use the mid function here color marker equals mid and then in parentheses then num comma 12 comma 1. so extract the 12th character of the then number that represents the color gonna press enter twice and then tab now we’re ready for our select case construct so we’re going to type select case and then color marker press enter and tab case 0 enter tab get color equals and then double quotes black so if the 12th number of the then is the 12th character of the then is a 0 that represents the color black press enter and we’re going to shift tab just till we get to the case margin and we’re going to type case 1 enter tab get color equals white and double quotes and press enter shift tab now i’m going to fill out the rest of the cases and the rest of this select case statement and then you’ll be able to just copy it from my screen now you can pause the video and complete your select case statement don’t forget the in select at the bottom if you need to make sure that that is there as well so you have your other cases there go ahead and get those populated and once you have that function get color completed we need to go back to the get new inventory procedure and we need to add the appropriate offset in our width and width block for the color and so it’s an offset of five columns so i’m going to click at the end of the get classification offset line and type another offset with a comma 5 dot value and that one’s going to equal get color and it’s using then number as an argument so we have that all set up now we’ll test the color in just a moment but first we’re going to create another function procedure and we’re not going to have to type this one from scratch because i have a text file that you’re going to access that’s in the video description that we’ll use for this one so in the meantime just go ahead and compile and save i’m going to do control and the end key to get to the very bottom of the new vehicles module and after that and make sure you’re after the end function statement that’s down there and you’re going to go to the insert menu and choose file in your files for video description or whatever your working directory is where you pulled in these text files you’re going to open the text files folder and we’re going to double click the get model text file so now if you look at the bottom of your screen it brings in this whole function and so saving you some typing here it’s using a select case statement here i’m going to just format it a little bit so i want a blank line after function another blank line after the variable declaration and then i want to have my yeah we’re assigning it we’re telling it what numbers from the vin number represent the model by using the mid function so it’s actually two characters the third and fourth characters of the then number represent the model so i’m going to put an enter after the model marker equals midline then i’m going to select everything from select case to end select and i’m going to tab to indent it now my ocd gets the better of me here i’m also going to tab in my cases and i can select multiple cases so we don’t have to spend time getting them indented properly and everything but my ocd is just going crazy right now because i’m not doing that but this is what happens when you bring it in from a text file i’m just going to go to the bottom and put an enter in front of in function so we have that space there and so you could see it’s two numbers starting with the third character of the then if it’s 16 it gives you the model as katera if it’s 17 it’s seville so on and so forth and now what we have to do is we have to make reference to this in the get new inventory procedure so that the result is in the right cell so i’m going to go back to get new inventory procedure using my procedure drop down and we’re going to add an offset here the offset for the model is three columns from the active cell so i’m going to click at the end of my offset comma 1 line and do dot offset it’s going to be comma 3 dot value equals get model with an argument of then number and we’re going to compile and save now we have one more that we’re going to do by typing it ourselves and then we’ll test these three so the last one we’re doing here if you look at the very bottom of my new vehicles module i have the framework of the function get make already set up and you need to copy that onto your screen recreate that onto your screen and then for the select case and select statement i’m going to put up a powerpoint slide and have you kind of work through it on your own get your function your variable declaration and the fact that the make marker represents the second character of the then in and once you get that in you’ll use the following powerpoint as your guide to build your select case statement and when you’re done building it you can go ahead and and pause this video while you build your select case statement you’ll be able to see my completed block of code and so you can see my completed get make function and now the only thing we have to do is get its offset reference and by the way the make is offset by two columns and we need to put that in our get new inventory procedure so i’m gonna switch to that procedure and put them in numerical order so i’m clicking at the end of the offset comma 1 pressing enter and i’m going to do offset comma 2 dot value equals get make and with an argument of then and now we can compile and save and we can switch over to excel so we’re just gonna get our procedure our calling procedure running by clicking on the tab you know how to do this go ahead and yes select the default of received vehicles and now we should have everything extracted in row 2 the year the make the model the classification the color dealer cost was already there and we have our msrp which is a calculation either 10 or 15 percent markup depending on the year well done everybody you can clear that sheet and return to the inventory sheet tab so we just used our conditional branching constructs all variations of the if then construct and the select case construct now we’re going to get into our looping constructs we have the 4-2 next loop which executes a series of statements a specified number of times we have a for each next loop which is used on collections and it loops through each object in the collection and then you have your do while and do until loops the do while loop statement does something if something else is true and the do until loop will do something until something becomes true we’re going to get started with our do loops so they’re used to execute a block of code repeatedly as we’ve been setting up our function procedures we’ve been seeing that it’s extracting the pertinent information from the vin number but it’s only populating the second row whereas we have other venlum numbers on the sheet and so we’re going to use these looping constructs to populate the rest of the sheet now there are two variations of the do loop do while and do until so the do while loop runs until as long as the condition is true and do until will run when a condition becomes true each of your do loops have two different syntaxes both of the constructs test a conditional value but the differences between the two control how they handle the tested condition here’s the two different syntaxes for do while you can start with do while and give it the condition and if that condition is true it will run the statement block or you can have it run the statement block before testing the condition which is the second syntax there so the first syntax will execute the statement block zero or more times depending on whether the condition is true the second will execute the statement block at least once because it’s not going to test the condition until it has executed the statement block and the same holds true for do until you can have it execute zero or more times by testing for the condition up front or you can have it execute the statement block at least once because it tests the condition at the end and then we have our four loops so four two next and four each next four two next executes a series of statements a specified number of times before each next loop is used on collections and it will loop through each object in the collection until there are no more objects so they do the same thing just in a different way so we’re going to switch over to the visual basic editor and what we’re going to do is we’re going to modify our get new inventory sub procedure by adding a do while loop to it the end result of this is that when we run the procedure in excel it is going to populate for all of the vin numbers on the sheet so all of the years makes models color classification all of that will be populated for all of the then numbers we’re going to start the modification look for the line in your get new inventory sub procedure that says then number equals active cell value click at the end of that line and press enter and we’re going to indent so i’m going to press my tab key and we’re gonna do do while two separate words then number and we’re gonna say not equal to so that’s the less than or great and greater than signs together do while then number is not equal to and we’re gonna put two double quotes to represent a blank so it’s gonna run this loop as long as the then number is not empty that’s what we’re saying to do there it will stop running this loop when it finds an empty vin number and now what we’re going to do we’re going to go down to add formatting line click in front of it press enter and up arrow and you have to give the loop keyword here so we’re going to just type loop and actually indent the word loop so it’s at the same margin as do while so it’s going to run this loop as long as the then number not equal to empty so not empty and then we need to add a couple of other things here under our offset comma 7 line click at the end of that line and press enter and we’re going to do an offset of one row so we’re going to do dot offset and then in parentheses one dot select and then underneath that after your offset one line press enter do shift tab and you’re gonna type then number equals active cell dot value so what does that do so we have our offset so as it’s extracting things from our function procedures it’s putting them in the right cells so after it does that we’re saying go down one row so right now the active cell right is range a2 which we assign to the then number variable so the first then number is in cell a2 and that’s what we’re assigning to the then number variable and now we’re saying go down one row so it’ll be on a3 the next vin number and it’s assigning that cell’s value to the then number variable and then it will keep looping until it doesn’t find any more than numbers we’re going to go ahead and compile and save and we’re ready to switch to excel to test it so start your procedure and of course select the default file name and now that you you can see that it populated for every vin number on the sheet we did that do while loop which says do continue doing this stuff right by extracting and putting it in the right offset columns continue doing this stuff until you have no more than numbers and it did just that so now the sheet is populated we’re going to perform a few more tasks in this file and one of the things that we want to do is i have another text file with and procedure in it called inventory append and what it will do is once you run the procedure in here and you get the sheet populated your new vehicle sheet populated it’s going to select everything from cell a2 through h11 so it’s purposely going to ignore the headings it’s going to select from a2 to h11 and it is going to cut that selection and then it’s going to paste it on the bottom of the inventory sheet so right now our inventory sheet goes through row 105 and anytime we bring in new vehicles we want them appended at the bottom of the inventory sheet so that’s one thing that we’re going to set up and then the second thing that we’re going to set up is we’re going to write a sub procedure that will then delete the data on new vehicles we’ve been deleting it manually this whole time and then we’ll add a line of code to call the procedure that deletes the data let’s first start by deleting the data off of new vehicles as we’ve been doing typically go back to your inventory sheet and then switch back over to the visual basic editor now we’re still working in the new vehicles module i want to get to the very bottom of that module and this is where we’re going to use a text file to get the inventory append code so we’re gonna go to the insert menu file and in your text files from the video description you’re gonna double click inventory append so when we look at that sub procedure right it’s using a an object variable dim last cell as range and then we have dem response as integer and we’re assigning the response to the outcome of a message box that says append the new inventory now it will have a yes no button and its title bar says append inventory if the user selects the yes button then it’s going to set the last cell to equal starting with h2 all the way down to the last populated cell in column h and then starting with a2 so basically it’s going to select the range a2 through h whatever the last row in column h that’s populated in and then it’s going to cut that selection switch to the inventory worksheet and it’s going to go to the bottom it’s going to find the last populated cell in column a and then it’s going to offset by one row so it’s going to go to the first blank cell in column a and start pasting the data from the new vehicles sheet tab and then it’s just going to select cell a1 and save the workbook that’s what that is going to do now we’re not going to test it right now we’re gonna test it in a moment we’re gonna create another sub procedure this one is short and quick so i didn’t have a text file for it click at the end of that in sub statement for your inventory append procedure press enter and you’re going to type sub clear sheet and press enter twice so we’re creating the sub procedure that’s going to tell it to clear the new vehicles sheet anything that’s on it so we’re going to just do an indent here and we’re going to type worksheets remember how to reference from a collection and then in quotes new vehicles close your quote close your paren dot select so go and select that worksheet and then we’re going to do cells dot select which will select all of the cells on the sheet kind of like us doing control a and then we’re going to do selection dot clear so clear everything in those cells and then we’re going to end with range and then parentheses and double quotes a1 dot select we want it to end up on cell a1 so that’s our clear sheet sub procedure so we’re gonna call clearsheet from within inventory append in inventory append we’re gonna click in front of activeworkbook.save and press enter and up arrow and we’re going to just type clear sheet to call that procedure so we want it to clear the new in the new vehicle sheet before the workbook is saved and last but not least we’re going to call the inventory append sub procedure from our get new inventory procedure so i’m going to go to my procedure drop down make my way back to get new inventory and we’re just going to add the call line here click at the end of the ad formatting line which is right above in sub press enter and we’re going to type inventory append to call that procedure and that procedure is going to call the clear sheet procedure now we’re ready to compile and save and switch over to excel so now we’re going to test to see if our append functionality works well by activating our new vehicle sheet go ahead and start your procedure use the default it will pop up and ask you if you want to append the new inventory now you’re going to select yes it clears the new vehicle sheet and when you switch back over to the inventory sheet remember we were at row 105 before and now we’re at row 115 because it appended the information from new vehicles onto the sheet you can go ahead and save your file we’re going to be using the sales fiscal year macro enabled file that we used earlier and in that file we’re going to use both of the four loops i’m gonna go ahead and close this vehicles file and i already had sales fiscal year file open i’m gonna just bring it back up and maximize it and i’m gonna actually switch over to visual basic editor here and make sure that i’m seeing this project because again sometimes if you have multiple files open you switch over it doesn’t update i want to make sure that i have the sales fiscal year project in project explorer then i go back to excel so this is the file earlier we had it do a sum function and place its result two rows down from the last populated cell in column i we did that earlier now we’re going to use our for loops because we have several sheet tabs of sales data on it and you’ll see how the for each next loop and the four two next loop are similar to each other we’re going to get the same result we’re just using two different loops so what we’re gonna do now is we’re gonna start with the four two next construct to repeatedly call that add totals procedures so all the worksheets have the selling price column totaled and i’m going to just switch over to the visual basic editor for that the project explorer window i’m going to collapse microsoft excel objects so that i don’t have all of those sheet instances showing up so we see or i’m looking at the module 1 code window and we see our add total sub procedure i’m going to click at the end of the end sub statement and we’re going to create another sub procedure and the first time we do it we’re going to use the 4 2 next construct so that’s when you have it run the loop a specific number of times and we’re going to create a sub procedure and we’re going to call it all totals and press enter twice and then we’re going to tab and we’re going to declare by using dim just a small letter i as an integer and press enter twice and then i’m going to tab again so my for loop is indented and for this one we’re going to tell it what i equals so we’re going to say 4 i equals one two worksheets dot count i equals one to however many worksheets are in the file and we’re gonna press enter after that line and tab we’re going to type worksheets and then in parentheses i dot select enter add totals enter shift tab so you’re at the same margin as your for statement and you’re going to type next i and then enter so you have a space between it and your n sub statement so we declared i as an integer and i represents worksheets one two three four five so starting with one i equals one to the total count of worksheets in the file we’re gonna select the first sheet and once the first worksheet is selected we’re calling our add total procedure it’s going to run on that first sheet then it’s going to go to the next i the next sheet run that procedure and it’s going to keep doing that until there are no more sheets to go to go ahead and compile and save and we’ll switch over to excel and test this out so we already have this sum configured on the 26th of august sheet and that’s fine we’re going to do alt f8 since we don’t have this attached to an event procedure and we are going to select all totals not add totals but all totals that’s where we put our four to next loop so i’m gonna just double click it so at some point during the execution of the program you will get this runtime error 1004 it says application defined or object defined error i will explain why this happened in just a moment but what we want to do is we want to click the end button in that error message and it takes us to the last cell well it takes us to a cell on the july 4th sheet tab if we do control home you can see that july 4th well it’s a holiday no sales happened on that day and that’s why we got that run time era so we’re going to fix that by adding some code so let’s go back over to visual basic editor the issue that caused the error is in the add totals procedure not the all totals one that’s calling ad totals in the add totals procedure we have to tell it that if cell i2 right is blank or if cell i2 is not equal to zero so if it’s if it’s unpopulated if it’s populated with anything other than a zero then run the procedure if it’s not populated with anything any number right then we want it to print the text no sales in cell a3 so we’re going to set that up you’re going to click after your dim total formula as string line and press enter twice and then tab and we’re going to use an if statement for this so if range and then in parentheses and double quotes i2 and we’re going to use our not equal less than greater than symbol 0 then if cell i2 is not equal to 0 then go ahead and run this code select everything from set down to active formula and tab it over click at the end of the activecell.formula equal total formula line press enter and shift tab and we’re going to type our else statement to go with if enter and we’re going to tab and we’re going to type range and then parentheses and double quotes a3 dot value equals and then double quotes no sales then we’re going to type enter shift tab and end if so your completed sub procedure add totals should look like my screen if the sheet is blank essentially right it’s going to put no sales in cell a3 if the sheet is not blank if there are values in column i then it’s going to calculate the sum and put it two rows below the last populated cell in that column that’s what we just set up there and we’ll test this soon go ahead and compile and save so in our all totals sub procedure we use the for to next loop now i’m going to show you the difference and it’s going to end up being the same end result between 4 2 next and 4 each next so 4 2 next repeats specific number of times in our example it repeats on every worksheet in the workbook for each next is used on collections so the easiest way to show you this is we’re going to use a for each next construct to duplicate the work that we have in the all totals procedure that we created with a 4 2 next construct so the first thing we’re going to do is select your entire all totals sub procedure and one of the buttons we added to the toolbar was comment block click on that comment block button and it basically puts the apostrophe before each line thereby commenting out that entire sub procedure at the end of its end sub statement press enter twice and we’re going to create another sub procedure named all totals you can’t have two with the same name so that’s one reason why we commented out our original one and for this one we’re going to use the for each next loop so we’re gonna just type sub all totals enter twice we’re gonna tab in and we’re gonna dim sheet as worksheet where creating like an object variable right every sheet is going to be declared as a worksheet here and now we’re going to press enter twice and tab and we’re going to type for each sheet in worksheets and that’s the worksheets collection right so all of the worksheets in the workbook for each sheet in the worksheets and we’re going to press enter and we’re going to tab again and we’re going to type sheet dot select enter add totals enter and then we’re going to shift tab and type next sheet the difference between this one and this one first one we did that we commented out the first one runs a definite number of times it runs from the first sheet until it runs out of worksheets this one we’re using the sheets as a collection object so for each sheet in the worksheets collection it’s going to select the sheet and then it’s going to call the add totals procedure and then it’s going to go to the next sheet in the collection and so on and so forth until it runs out of sheets so after your next sheet you should have the blank line and then you’re in sub statement so since we’re calling the add totals procedure which we modified so we wouldn’t get that runtime error we’ll see the results of our modification as well when we run this new all totals procedure go ahead and compile and save and we’re ready to switch to excel and test this out so i’m gonna just go back i’m gonna right click on my tab scrolling arrows in the lower left corner and i’m gonna go back to the first sheet which is 26th of august and that’s the one that we calculated the sum of the selling price before and now i’m going to do alt f8 to bring up the macros box and we’re going to double click all totals and so you saw your machine kind of click and were right it left me on june 1st and we see that we have the total of the selling price and it’s two rows beneath the last populated cell in column i i’m going to right click on my tab scrolling arrows and navigate to the 4th of july and that was one sheet that caused an error before because there were no sales on that sheet and so now you can see in cell a3 on the 4th of july sheet that it actually has no sales so we diverted it from having that runtime error go ahead and save your file in this lesson we went over control of flow structures and we utilized pretty much all of them so we worked with our looping structures we worked with our decision structures and so we started with our um just a general understanding of the structures of our controller flow structures and their variations you learned about boolean expressions and how to combine them with comparison and logical operators we went into conditional branching and that’s when we used our if constructs and our select case constructs and then we finished by using our looping constructs we used our do loops and then we did both variations of the four loops the four two next structure and the four each next structure thank you for attending excel 2019 visual basic for applications video course hi everyone i’m trish connor cato welcome to the excel 2019 visual basic for applications video course this course is for beginning users looking to automate repetitive and recurring tasks in microsoft excel vba is microsoft’s programming language and it’s built into the office applications our focus during this course is on excel specifically you’ll be equipped with the basics to start writing your own vba code modify the code behind macros you’ve already recorded and have an understanding of how vba lends itself to creating efficiency in your daily tasks we move into creating a form and programming its controls during this lesson you will learn about form properties events and methods and learn how to add controls to the forum and modify their properties you’ll ultimately launch a form with code the next lesson will take you through the steps necessary to create pivot tables programmatically and visual basic for applications if you’re enjoying these videos please like and subscribe if you want to earn certificates and digital badges please become a member of our patreon the link is in our video description if you have any questions you want answered by one of our instructors please join our off-site community the link is in the description as well as always if this course has exercise files you’ll find them in the video description below now we’re going to get started with lesson six working with forms and controls we have several topics to cover in this lesson you’re going to start learning about the userform object and then its properties events and methods there’s a toolbox we’ll be using to add controls to the user form we’ll go over what kind of controls will be able to access from the toolbox we’ll be adding controls to the form and modifying the control properties formatting the controls and then we’re going to apply code to the controls to determine what their use is going to be finally you’ll learn how to launch the form via code we’re going to be using our sales fiscal year file as well as accessing another text file named coding controls during this lesson so far in this course you’ve created message boxes and input boxes you’ve learned that message boxes display messages and accepts input from the user via buttons in our case it was ok and cancel buttons an action is then taken on that input via coding input boxes display messages to the user but also allow the user to type in one input or have it default just like a message box input action is taken on the input box via coding the userform objects allow for multiple inputs which can then be coded to perform specific actions these inputs can be text check boxes or drop down lists for example and they’re known as controls user forms have properties events and methods that can be accessed these next few slides are for your reference after you’ve completed the course i will be guiding you through this as we do exercise so i have a slide with a description of form properties that can be accessed the next one are form events so for example the click event and whatever action is attached to it will occur when the left mouse button is clicked went over the form and the next slide is about form methods you have cut copy paste hide move so on and so forth and again i will be walking you through these during the exercises in this lesson the one that i do want to cover with you now are form control prefixes we’ve used lowercase mod as a prefix for a module and so if you’re looking at them in a list you’ll see them all begin with mod we have prefixes for form controls and i’ll guide you through these as we use them but for example chk would be a check box cbo is a combo box and we’ll be utilizing these throughout the lesson each form control has its own set of properties and they differ depending on the type of control but this slide has a list of common control properties that most controls have so you have like a height property a width property that type of thing and again the slide deck is in the video description so you’ll have access to these reference slides we’re ready to get hands-on now with the userform object before we insert a userform object into our sales fiscal year excel file let’s talk about the different types of modules again we did a brief review early in the course your standard code is stored in modules like in this project we have module one we could have renamed it we didn’t we’ve also in a different file created event procedures and if you expand your microsoft excel objects folder in the project explorer window you’ll see one for each sheet and all the way at the bottom of all of the sheets you have one called this workbook and in our vehicles macro enabled file we did an event procedure based off of the new vehicles sheet tab which was known as sheet 3 in the system your sheet modules and this workbook module are where you store event procedure codes and i’m going to just go back up and collapse the excel objects folder so i don’t have to look at all of those sheets so we have our regular module where you store your function procedures your sub procedures and then you have your event procedure modules your worksheets and this workbook now we also talked about early in the course a class module the modules we’ve been using like module one that’s a standard module class modules we’re not going to use in this course however those are used to create your own objects and so now we’re going to create a user form and that actually sets up a forms folder and no matter how many forms you create in this particular file they will all go into that forms folder so it’s almost like another module just for form user form objects and you’ll see that now as we go to insert our user form so we’re going to just go up to the insert menu and choose user form and now a couple of things happened you have the blank grid a framework for your user form object on your screen and attached to it is a tool box which you’ll use to access the controls that you’re going to put on the form now i’ll give you a heads up here sometimes if you have double monitors your toolbox may show up on another monitor and it could be behind some other open windows so if you need it you may have to search it out if i click on a blank area here try to deselect this user form it’ll disappear but then it’ll reappear when i click back on the user form typically and we can always get it back by using the view menu now i’m going to close my toolbox for a minute it has an x in its upper right hand corner so that i can see in the project explorer window that i now have a forms folder with one form in it which it names by default userform1 now we’re going to use the properties window to change some of the properties for our user form object and again if your properties window is not showing on your left hand pane you can go to your view menu and select it or you can press f4 to bring it up we are gonna give the form a name using the appropriate prefix we’re gonna give it a caption which will show in the title bar of the form and we’re going to give it a height and width measurement so in the properties window we’re going to start with the name property we’re going to double click name in parentheses and we’re going to type lowercase frm capital g generate capital r reports so that’s the system name of the form frm generate reports the next property we’re going to do is the caption property and again that shows in the title bar and we’re going to type just in plain english and as you’re typing it you can look at the title bar and see it populating generate sales reports and i’m pressing enter after i change a property we’re going to double click height and we’re going to make it 300 and we’re going to scroll down if necessary double click with and we’re going to change that value to 400 and by the way the height and width values would change if we manually resize the form by dragging its sizing handles in the next exercises we’re going to add controls to the form and set properties for those controls so the first thing we need to do is display our toolbox again and we can get that from the view menu because we closed it by using its x so we’re going to just go to view toolbox and the tool box shows up again and we can move it so you can see it clearly and if you look at the controls in the box as you hover over them so the first one is your mouse pointer it’s the select objects control the next one is a label third one is a text box you have a combo box list box so on and so forth so we’ll be using several of those controls placing them on our form and you’ll learn also how to size and align your controls a little bit later in these exercises so let’s get started we’re going to add start date and end date label controls to the form so in my tool box i’m going to look for the label control it’s the capital letter a and i’m gonna click on it on the toolbox and now if i move my mouse over the form grid it looks like a crosshair i can click and hold and draw the label control or i’m going to just click in the lower left corner of the form and it places the label control there for me and so now with that label control selected we’re going to change some of its properties so typically you don’t name labels unless they’re going to be some kind of code attached to them so we’re not going to use the name property we want to look at the auto size property so the auto size property is set to false if we double click auto size it will change it to true and we want it to be true and then the caption property is the text that shows on the label so i’m going to double click caption and i’m going to type end date in plain english followed by a colon and press enter and now you see the end date text populating the label and then you notice how it wrapped end date within that label control we don’t want it to do word wrap so the last property is word wrap and it’s set to true we’re going to double click it to set it to false so it doesn’t wrap the words in the label and i’m going to just manually move so i want my mouse pointer to look like a four-headed arrow on that end date label and i’m going to just drag it down just a little bit we also want a start date label so instead of starting from scratch i’m going to just right click on the end date label and i’m going to choose copy and then i’m going to right click in a blank area of my form grid and choose paste so now i’m going to move the copy of the end date label above the existing end date label and now it’s just a matter of changing some of its properties a couple of things we didn’t give the label a name so we don’t have a label name here our other property auto size is set to true already because we copied it and word wrap is set to false and it’s the caption property we’re gonna change so i’m gonna double click caption and i want it to say start date in plain english with the colon and press enter so copying it actually saves you time because it copies some of the pertinent property information as well now we’re going to add two text box controls we’ll do the first one and then copy it and modify the properties for the second one we’re going to find in the tool box our text box control and it’s the one that has the lowercase a b to the right of your label going to select it and again when my mouse is on top of the form grid it looks like a crosshair and i’m going to click to the right of the end date label and let it place the text box there i’m going to move mine up just a little bit so it’s more in line like that and with that text box control selected we are going to give it a name so in the properties window we’re going to double click name we’re going to use lowercase t x t as the prefix for a text box and we’re going to type capital e and capital d date so txt end date and the other property that we’re going to change for the text box is its width property and we’re going to make the width 50. and then we’re going to copy that text box paste it on the grid and move it down so it’s to the right of the start date label and on the copy we’re going to just change the name of it to txt start date and notice the name property didn’t come over with the copy because you can’t have the same name for controls on a form object so txt capital t capital s start capital d date is what we’re naming that text box when this form is completed and totally coded it will generate sales reports based on user choices in the form and as such we want to add two buttons to the form we want to add a display button and a cancel button so we’re going to use the command button control in your tool box the command button control is in the second row it’s the second one on my screen in the second row and it looks like a lowercase a b as well when you hover over it of course the screen tip will let you know it is command button so we’re going to go ahead and select it in the toolbox and we’re going to place a command button like in the upper right hand corner of the form in the properties pane we’re going to name it using cmd as the prefix for a command button capital d display so cmd display is the name and the caption we’re going to go down to the caption property and that’s the text that shows on the button and it’s just going to be display in plain english and the last property we’re going to change is the default property default property is currently set to false we’re going to double click it to make it true so the default property when it comes to a command button is you can press enter to make that button happen instead of having to click on it that’s what the default property does and you can only have one default property on a button on your object your userforum object so we have cmd display and we gave it a caption of display and we changed the default property to true now we’re going to copy that display button paste it on the grid and drag the paste it version underneath your original display button and again don’t worry about alignment we’ll fix that later so on the copy notice the name didn’t carry over right we’re going to name this one c md capital c cancel we’re going to give we’re going to change the cancel property here from false to true and that means you can use the escape key on your keyboard to make that button happen and so we set cancel to true the caption property we’re going to change it to cancel and the default property we need to change to false because you can only have one default command button and that is the display button if you click on a blank area of your grid you’ll see the display button has like that dark border around it whenever you see a button like that in a dialog box it means you can press your enter key to make that button happen this would be a good time for us to go ahead and save right from the toolbar before we continue adding controls to this form now we’re going to add a combo box control to our form so the combo find the combo box control in your tool box and select it and we’re going to put it in the like the lower right hand corner of the form in the properties pane we’re going to change its name to prefix of cbo and then capital m month we’re going to use its list rows property and that just says how many rows will be in the drop down list so we’re going to change list rows to 12 and then the match required property we’re going to double click that to change it from false to true in visual basic controls a combo box by default says no match is required which means that the end user can type in their own entries and use them from the list we don’t want that to happen we want them to pull just from the list that we’re going to populate later so we have our combo box in the lower right hand corner and now we’re going to click in a blank area of the grid and you can copy your start date or end date label because we’re going to want another label and we’re going to paste it onto the grid and then we’re going to move that label to the left of the combo box i’m going to just move mine down a little bit and again we’ll do some alignment stuff in a little while so now we just have to change the label properties now we’re going to use this label later and code some stuff for it so we want to give it a name so we’re going to name this lbl prefix for a label month capital m month and we’re going to give it a caption of 4 which month question mark and then i need to move my label over because it auto expand it so it’s not overhanging my combo box so your form should look similar to mine at this point now we’re gonna add two frame controls to the form and we’ll add the first one of course copy it to create the second one but the frame control is utilized to group related other controls together so we’re going to start by adding our first frame control on my toolbox the frame control is the first one in the second row it has an x y at the top of it we’re gonna click that and i’m gonna click like in the upper left corner of the form grid and now in order to make space for the other frame i’m going to move this frame over as far left as i can where i can actually see the borders of it and then i’m going to decrease its width manually by just clicking on the right center sizing handle so my mouse looks like a double-headed arrow and dragging it backwards about that much and so we’re going to give the frame a name and it’s going to be fra is the prefix for frame control capital p period and we’re also going to give it a caption of period and the caption is what shows up the upper left hand corner of the frame now we’re going to copy that frame paste it onto your grid and drag the pasted frame to the right of your period frame and for this one we’re going to change the name property to fra sales and we’re going to give it a caption of sales so the next thing we’re going to do is we’re gonna add three option button controls into each frame we’re gonna find the option button in the tool box and it looks like the little circle with a dot in the middle of it the next to the last one in my first row and i’m gonna select the option button and now i’m gonna click inside the period frame and then i’m gonna copy that option button and i’m going to paste it twice inside the period frame so you’ll have three option buttons inside your period frame and if you click on the top one you’ll see in the name property it’s option button one second one is two second one is three you kind of want to have them in the right order for tab order purposes a little bit later and again we’ll deal with the alignment a little bit later and i’m going to show you how to get three option buttons in the sales frame now too another efficiency tip here what we can do inside the period frame just click in a blank area inside the period frame and do control a and it selects all three option buttons right and then you can just do control c to copy them and then right click inside your sales frame and paste let’s do the properties for these option buttons so the first one inside the period frame should say option button one as its name property its name property is going to be opt as the prefix capital m month and we’re going to give it a caption of month and you can see the caption shows instead of option button one the second option button in the period frame which name is currently option button 2 we’re going to change it to opt all with a caption of all the last option button option button three in the period frame its name is going to be opt other with a caption of other so we have month all and other option buttons in the period frame let’s go to the sales frame so the first one in the sales frame since we copied it it’s now option button four and we’re going to give that a name of opt sales person with a caption of salesperson and i’m making that caption plain english two words and then the next one in the sales frame option button five that one is going to be opt model with a caption of model and last but not least option button six its name is going to be opt classification with a caption of classification so now we’re ready to do some formatting of our form controls and we’ll start with alignment and grouping we’re going to start by aligning the option buttons in the period frame so just click in the period frame and do ctrl a like we did before to select the option buttons and we can go up to the format tab the format menu hover over a line and we’re going to click on lefts so those three option buttons are aligned by their left edge let’s do the same thing in the sales frame also align those three option buttons by their lefts now we want to align our two frames by their tops so i’m going to select the period frame hold down my control key and select the sales frame that’s one way of getting them both selected i’m going to go back to format menu align and this time we’re going to choose tops and we can click away and see they’re perfectly aligned by their top edges now now we want to group the options buttons in each frame so that if we move any one of them all of them will move they’ll retain their alignment and everything so i’m going to just click in the period frame and do control a to select all three option buttons i’m gonna go to the format menu and i’m gonna click on group and now you’ll see there’s one border around all three option buttons instead of three separate borders they’re grouped together now do the same in your sales frame now i’m going to show you how to use a selection net also known as a selection marquee has a lot of different names to select different objects so we want to align the period frame and the start date and end date labels by the left edges so i’m going to click slightly above and to the left of the period frame click and hold and drag down until your start and end date labels are within that little guideline so now when you let go it selected the period frame and the start and end date labels that’s called a selection net and we’re going to go to format align lefts let’s use a selection net to select our display and cancel buttons as well as our combo box and let’s align those by their left edges as well at this point we haven’t coded any of our form controls yet but we want to test our form make sure it displays properly and specifically we want to test the tab order on the form just make sure your form is selected and you can use the run button on the toolbar run sub user form button or you can just press f5 to run the form and the form should pop up on your screen it’s on top of some other module so we want to test the tab order on the form now when i bring up the form notice that it’s flashing in the end date field that’s where it’s starting if i press the tab key on my keyboard it then goes to start date if i press tab again it looks like it has the display button and then the cancel button and then the combo box then it goes into the period frame and it’s on month then all then other then it goes to the sales frame and it’s on salesperson then model then classification the frames the tab order is perfect because we made sure that the option button copies were in the right order so option button one two three four 5 6. but we can see that the rest of the tab order on this form is not the way it should be so we’re going to go ahead and fix that go ahead and close the x button in the upper right hand corner of your form and it should take you back to your form design view if you will if not you can double click frm generate reports in your forms folder in the project explorer window so we need to adjust the tab order here so we’re going to go to the view menu and on the view menu you’re going to select tab order and i’ll move this box here so we can see it a little bit better the labels don’t have to be included in the tab order because we don’t want to tab to any labels in there at this point so the tab order that we want is that it start period frame and then go to the sales frame so they’re at the bottom of my tab order list which is why it went there last i’m going to click and hold on fra period and drag down to select fra sales and with both of them selected on the right side i’m going to use the move up button until they’re in the first and second position then i’m going to click on txt start date move that up so it’s in the third position and put txt end date in the fourth position we want our combo box cbo month to be underneath the end date text box and then we want our command and display buttons underneath cbo month and again we’re not concerned about the labels because labels are not input controls we can click ok and then we’re going to do f5 so we can test the tab order on our form notice that the month in the period frame is already selected when we do tab it’s going to go to all and then other then into the sales frame sales person model and classification after that it jumps down to the start date text box then to the end date text box then to the combo box finally the display button and the cancel button we can close the form again by using the x in the upper right hand corner when we code the controls on our forms we’re going to be doing them in what are known as built-in class modules these modules contain procedures that are used to respond to events for a form or maybe a worksheet or that performs tasks in support of the form or worksheet so we’re going to be populating our combo box for starter by using code so what we’re going to do is we’re going to right click on the form anywhere in the blank area of the grid and this is only one way of doing this and we’re going to choose view code so now if you look up at the top right gives you the file that we’re in but it says frm generate reports code that is a built-in class module this is the code just for that particular form the first thing we’re going to do is explore the object list where it says it defaults to user form right and notice the user form default procedure is the click event we’ll do the drop down next to to the right of user form and you’ll see all of the controls that we’ve placed on that form and this is a good example of when using the prefix is handy your command buttons are grouped together your frames are grouped together your option buttons are grouped together as are your text boxes so you don’t have to keep looking through a list for something not knowing what the actual control is so that’s a good example of why you want to use those prefixes here we’re going to leave it on the user form object now i mentioned that it defaults to the click procedure but we want our code to be based on its initialize procedure so to the right of click in your procedure list you’re going to select initialize and just like when we did an event procedure earlier we don’t need to keep the framework for private sub user form click we’re going to just delete that and leave our private sub user form initialize in sub statement the initialize procedure happens when the form is loaded into memory so when the form is run that’s when this procedure will happen at the end of the private sub line we’re going to press enter twice and we’re going to do a with end with statement so i’m going to tab over and i’m going to type with and then cbo month so that’s the combo box the month combo box i’m going to press enter tab i’m going to do dot and the list pops up we want to use the add item method so dot add item space and then double quotes jan for january now you can copy that add item line we need 12 of them january through december and we’re just using the three character abbreviation for the months with no period and once you have your 12 add item lines we’re gonna shift tab and we have to have our end with statement and you can go ahead and compile and save and in your project explorer window you’re going to double click frm generate reports we’re going to press f5 to run it and we just want to test our drop down so go to your for which month drop down and you should see january through december there we added those items to the combo box and we can close generate sales reports form and we’re going to change one property for that combo box so select the combo box on your form grid and we’re going to go down to its text property and that’s like the default property so we want it to default to january so we’re going to just type j a n there and enter and now if we i have to select my form first and f5 we’ll see that the for which month combo box is now defaulting to january and we can close it another way to access the code window for the form is just by double clicking on the form grid and that will take you to your built-in class module and it’s built in because a form is a built-in object here in excel vba so unlike a regular class module where you’re actually creating objects that are not included in the application this is a built-in class and so we’re in the code window and we’re going to hide controls based on when another control is selected so for example if month is selected in the period frame we want to hide the start date and end date labels and text boxes and we have several event procedures to code so we’re going to insert a text file and then review the code for your understanding first we’re going to declare some variables and we’re going to click at the top after option explicit and press enter and we’re going to do public sales comma period as string and press enter so we’re declaring variables up in the declaration section and we’re making them public so that means they’re available to any modules here and then we’re going to click underneath our end with statement we’ll click at the end of it and press enter and we’re going to type cbo month that’s our combo box name dot visible which is a property equals false which shows up on your list right underneath that we’re gonna type lbl month dot visible that’s its label equals false so right now it’s telling it not to show the combo box or the label but we’re not done yet so we’re going to click at the end of n sub and press enter and then we’re going to go to our insert menu and choose file and we want to grab that coding controls text file so we can just double click it and boy did it help us with a lot of typing look at all the stuff that’s in here we’ll go over with all of this code that we didn’t have to type means we declared two string variables sales and period the first thing that came in from the text file is private sub cmd cancel click so when the cancel button on the form is clicked it’s going to unload the form from memory and me is just a shortcut for the current object in this case the form so that’s one thing that came in from the text file coding that cancel button and then we have our opt all button when that option button is selected when it’s clicked or accessed it’s going to set the period variable to all when the classification option button is clicked it’s going to set the sales variable to equal classification when the model option button is clicked it’s going to assign model to the sales variable so we need to do a fix here because i just noticed that model doesn’t have double quotes on it coming from the text file and it needs to or we would get an error message and you might want to make a note if you want to avoid that later to just go into the text file and change it in there so the next sub procedure is opt month when it changes if that opt month button is clicked right and you see this next sub procedure it’s going to set the period to equal month if opt month equals true then we want the combo box and the label to be visible or else we want them to be hidden unless they need to select a month they don’t need to have the label or the combo box showing up on the form and then we have we’ll go to our private sub opt other this one has a change event and this one has a click event so when it’s clicked the other option button it will set the period to other and if it’s other then we want the start date and end date text boxes to be enabled so they’re accessible if they select other in that frame or else we want them to be disabled so they’ll still be visible but the end user won’t be able to access them and then the last but not least if they select the sales person option button in the sales frame it’s going to set sales variable to equal sales person and you want to go ahead and compile and save let’s go test some of this so i’m going to just double click my form in the forms folder in project explorer to get back over to it and the first thing we’re going to do is in the properties pane we’re going to disable the start date and end date text boxes so i’m going to click in the start date text box and i’m going to double click the enabled property to change it from true to false and i’m going to do the same with the end date text box and now i’m going to go ahead and press f5 to run the form so make sure you’re just on the grid and you don’t have any control selected and then f5 will be successful for you and so the first thing i want you to do is try to click in the start date and end date text boxes and you cannot in the period frame select the month option and you’ll notice that the combo box and its label will now become visible and accessible on the form if you select the all option button in the period frame your start date and end date text boxes are not available to you because we want it to run all the reports for all of the dates and then if you select the other option button now you have the ability to get into the start date and end date text boxes so in the background on my screen you see that opt other change is what’s causing that so if they select opt other if they select the other option button it’s going to assign the period valuable the value of other and it’s going to enable the start date and end date text boxes and now we’re going to use the x in the upper right hand corner to close the form again and the last thing we’re going to do instead of us having to go to the forms folder and double click the form and then f5 to run it we want to launch it programmatically so we’re going to do that now we’re going to go over to our project explorer window we can right click on the modules folder hover over insert and choose module and we’re going to rename module 2 in its properties window we’re going to name it mod reports and in mod reports we’re going to type a very short sub procedure so we’re going to type sub we’re going to name it show form press enter twice and we’re going to tab over we’re going to type the name of our form including its prefix frm generate reports the dot notation and then we want the show method we just created a sub procedure that will show the form when this procedure runs and now we can compile and save and we could just execute the procedure by pressing f5 anywhere within it it brings up the form and because we brought it in from a text file we coded the cancel button we can actually use the cancel button to unload the form from memory and close it in this lesson we learned about and used the user form object we changed some form properties and we went over some properties events and methods for form controls we accessed the toolbox to be able to get to our form controls and we added controls to the form and modified their properties and then we did some formatting of form controls in terms of alignment and grouping and we moved on to creating code for form controls in a built-in class module and we used a lot of code from a text file that was in the files in the video description we ultimately ended up launching the form via code and we will be revisiting using the form in a later lesson in lesson seven we will be working with the pivot table object and visual basic so the first thing we’re going to do is create a pivot table in excel and then we’re going to create a pivot table in visual basic for applications when end users use the form that we created in the previous lesson it is going to generate pivot table reports based on the user’s choices on the form after we get our pivot tables done we’re going to finalize our form and then you’ll learn how to add code to a button in excel for ease of use pivot tables allow you to summarize data from a worksheet or an external data source and create reports you can decide how to summarize the data and the data to be analyzed and after you create a pivot table you can pivot the data to look at it in different ways for different analysis when you’re creating a pivot table in vba two separate objects are used the pivot table object which is the pivot table in the workbook and the pivot cache object which is a memory location that’s created and it holds the source data the pivot table is created from when you’re doing this in visual basic the pivot cache object needs to exist before a pivot table is created so you use what’s known as the create method of the pivot caches collection object to create that pivot cache in vba and i have on this slide it’s syntax the one required argument is source type and then you have two optional argument source data and version the source type argument has five options in the form of excel constants so we saw visual basic constants earlier they’re preceded by vb like when we were working with the message box right these are excel constants which are preceded by xl so you have consolidation database external pivot table and scenario process wise once the pivot cache is created the create pivot table method of the pivot cache object will be accessed to create the pivot table and it has four arguments as listed on this slide table destination table name read data and default version and the final three the only one that’s required is the table destination argument and again this is background information for your future review if you need to refresh on anything i will be guiding you through this when we get started the pivot cache and pivot table can be created in the same procedure and the fields that are going to populate the pivot table have to be set up separately within what’s known as the pivot fields collection yes this sounds complicated until you get used to it when it comes to pivot fields collection it’s a member of the pivot table object and it contains the columns of data from the data source the pivot fields orientation property is used to populate the pivot table report field names are assigned to the values in each column based on the column headings an excel constants are used here as well your if you’re used to pivot tables you know you have row labels column labels you have report filter you have values so the excel row field would be for your row labels excel column field for your column labels excel page field is used for the report filter an excel data field is used for the values you have an extra constant here excel hidden which is used to hide a field and then at the bottom i have the syntax of the orientation property for your future reference so we’re going to start in our sales fiscal year file by recording two macros to create the pivot table so i’m on the 26th of august sheet tab and i’m going to just click anywhere within my data there and we’re going to start a macro recording so i’m going to use the mac no macros currently recording button down in my status bar that we used earlier i’m going to click on that and we’re going to name this macro create pivot table and then we’re going to just click ok now just make sure you’re anywhere within your data and except for on that sum of the selling price we’re going to be anywhere within the data go to the insert tab of the ribbon and the first button is pivot table i’m going to click the upper half of the button in the create pivot table dialog box you’ll see that it has selected all of your data we were just anywhere within our range and it will select everything until it finds a blank and that’s the choice we wanted to use select a table or range and then the next choice you make is choose where you want the pivot table report to be placed it defaults to a new worksheet which is typically how they’re used and so we can just click ok so we’re on a new sheet we have the framework of our pivot table on the worksheet and to the right we have our pivot table fields list this is where we need to stop this recording remember it’s a two-step process even when you’re recording it as a macro in excel the first step is to create the framework of the pivot table and we’ve done that so i’m going to go down to my status bar and select stop recording now we need to record a macro that will select the fields that we want in our pivot table report so i’m going to go back to my status bar and start another macro recording and this one i’m going to name select fields and click ok in your field list on the right you’re going to drag your year field to the filters box underneath and notice your pivot table report is already starting to shape up we’re going to drag classification to columns and we see our pivot table we have our column labels and it’s showing the classifications car suv truck minivan we’re going to drag well we could put a check box in front of make and it will automatically put it in the rows box and we’re going to put a if we scroll down we’re going to put a check mark in front of selling price and it’s automatically going to put that in the values box so any text space field will automatically go into rows and any numeric field will automatically go into values and the default aggregate that’s used is the sum function so now in our pivot table we can see our row labels are the makes of the vehicles our column labels are the classification and we’re getting the selling price for each combination there now we’re ready to stop our macro our second macro from recording so you could stop the recording and let’s switch over to visual basic editor and in project explorer i’m going to collapse that microsoft excel objects folder and now you’ll notice we have mod reports module 1 and module 2. we’re going to double click module 2 and that’s where it put the code for the two macros we recorded and we’re going to rename module 2 so using its properties we’re gonna name it mod sheet pivot so this is the code that was created when we did our create pivot table macro right it’s adding you can see it’s referencing the pivot caches object right and we’re using the source type of excel database and you have all of this code that was generated by your two separate macro recordings and then we had to record a separate macro for selecting the fields and that’s where you’ll see those excel constants for page field column field row field so on and so forth so if you create a pivot table while recording a macro in excel you have to record two macros one to set up the framework of the pivot table and the second one to populate the pivot table report with the appropriate fields now we’re going to start creating our pivot table in visual basic editor and so we’re going to start by creating the pivot cache and pivot table objects which can be in the same procedure as you’ll see but before we do that switch back over to excel and delete the sheet that has your pivot table report on it and then we’re going to insert a new sheet a new worksheet and we’re going to name it reports and the sheet tabs in your excel file should look like mine on the screen so i’ve made the report sheet the first one and i deleted the other sheet where we recorded our macro and created the pivot table and now we can switch back over to the visual basic editor in your project explorer window switch to mod reports where we have just that one small sub procedure that shows the form we’re going to click after the in sub statement here and you’re going to type the sub procedure that i will display on my screen momentarily i’ve changed my font size to 18 so you can create that sub procedure that we’re naming create pivot based on what’s on my screen we’ll talk about it after you get it typed in in this sub procedure we are declaring two object variables destination and range data both with the range object type we’re setting the destination variable to equal that reports worksheet cell a1 that we just created in excel and we’re setting the range data object variable to equal the range a1 through j1 all the way down to the last populated cell in column j after that we’re accessing the pivot caches object so activeworkbook.pivotcaches.create and i’m using the line continuation character there space and underscore and this time in the parentheses we’re using a different syntax and we’re doing this here because you’ll probably come across it in code that you inherit so we’re actually naming the arguments and separating them from their values by using a colon and an equal sign so the first argument for the pivot caches is the source type and for an excel spreadsheet the data on an excel spreadsheet you use the excel constant of excel database the next argument is the source data and that is going to be the range data so a1 through the last populated cell in column j and then we’re doing another line continuation character at the end of that line and now we’re moving on to the create pivot table method of the pivot cache object and that line starts with dot create pivot table and then we’re giving it a destination for the table which is what we populated as the destination object variable so the report sheet cell a1 is where we’re going to start the pivot table framework and then we’re naming the pivot table sales pivot let’s go ahead and compile and save our work and we’ll switch to excel we need to run that sub procedure our create pivot procedure on a sheet that’s populated with data so i’m going to go to my 26th of august sheet tab and i’m going to just be anywhere within my data and i’m going to do alt f8 to bring up the macros dialog box and we want to double click create pivot it doesn’t initially look like anything happened but we told it to put the framework of the pivot table on the reports sheet tab so let’s go to reports and we’ll see the framework of our pivot table so now that we have the framework of our pivot table we’re going to switch back over to the visual basic editor because we have to create our fields collection regardless of whether you’re creating a pivot table by recording a macro or by using visual basic for applications it’s going to be a two-step process we’re going to be still working in mod reports and we’re going to go up to the top and click after option explicit we need to declare some variable names up here so we’re going to type public and after we click after option explicit i pressed enter we’re going to use the public keyword page name comma row name comma column name comma data name as string so four string variables we declared in the declaration section and you can press enter so now we’re gonna go to the bottom of our create pivot sub procedure click at the end of the end sub statement and press enter and we’re going to create another procedure sub procedure here so we’re going to type sub and the name of it is set fields and press enter a couple of times well we’re going to declare an object variable here within the procedure so we’re going to do dim and then i’m just calling it pvt table as pivot table and pivot table will show up on your list underneath that we’re going to use the set statement remember we have to use set for our object variables set pvt table and then equal worksheets and in parentheses and double quotes reports dot pivot tables and in parentheses we need to put what we named the pivot table which is in quotes it’s sales pivot and then we’re going to close those parentheses we’re going to press enter twice and we’re going to do a with end with block so we’re going to indent and we’re going to type with pvt table enter and tab we’re going to do dot pivot fields which will show up on your list and then in parentheses page name dot orientation equals xl page field so we’re referencing that constant and just a reminder the excel page field constant refers to the field that’s going to go into the report filter box we’re going to press enter and we’re going to do dot pivot fields again this time in the parentheses we’re going to type row name dot orientation and this one is going to equal excel row field so the field that’s going to go into the rows box for the pivot table enter again we have two more of these lines that we have to do so dot pivot fields and use the list as necessary to decrease your typing and in parentheses for this one we’re going to do column name dot orientation and this one equals xl column field and last but not least we’re going to do dot pivot fields in parentheses data name and that’s for the values dot orientation equal excel data field we’re going to press enter and shift tab and we’re going to type in our end with statement and enter again so now what we’re going to do is we’re going to finish up this sub procedure we have four more lines to type and i’m going to shift tab to out dent so i’m at the same margin as our dim and set lines and we’re going to type active workbook dot sheets and then in parentheses and double quotes reports dot activate and i’ll scroll down so you can see this a little bit better our next line is pvt table like our object variable name dot pivot select then we’re going to type a space in a set of double quotes comma and from the list that pops up we’re going to select excel data only another excel constant so the data field is the values field and we want to we’re typing this line to say select all of the values and we’re going to press enter and then we’re going to tell it how to format it so selection dot number format equals and in double quotes we’re going to type a dollar sign pound sign comma two more pound signs and a zero and then close your double quotes the number format and i have it highlighted on my screen that we’re using so it’s going to start it with a dollar sign and the pound represents any digit that may be in that position you have your thousand separator is the comma and then we have two more pound signs so digit placeholders if they’re in that position it will put them there if not it will skip it and we’re saying that we’re not going to have any decimal places on our numbers here if we wanted decimal places after the ending zero we would we could do a dot and then zero zero which means that it would have two decimal places the zero that’s sitting there instead of the pound signs or as they’re now known hashtags that would represent a leading zero for a number if it’s less than one so that’s the number format and you’ll see it once we finish this up and now we have one more line to finish this set field sub procedure and we’re going to just type range and in parentheses and double quotes e1 dot select this is going to set the fields whether they’re filter fields row fields column fields or your values fields for the pivot table that we created because the variables will not populate until we actually run the form again we’re going to be able to test this our sub procedure for setting the fields in just a little while we have some more tasks that we’re going to complete that i have under the heading finalizing the form what we’re going to do here is we’re going to create code that will generate pivot table reports based on the selections the user chooses in the form so in other words we’re going to distribute user responses to the correct procedures specifically we’re going to create code that will perform these steps when the user activates the display button on the form we want it to hide the form and whatever option is selected in the period frame will be evaluated determining the month or the start date and end date of the pivot table report the sales option that is selected in the sales frame will also be evaluated and at this point the variables containing the field names will be populated then the source data will be pulled from the workbook and placed on a new sheet and then the data will be moved to a new workbook and the pivot table will be created so we’re going to get started on these finalizing the form steps and i’m still in visual basic editor and in the project explorer window i’m going to expand forms folder and double-click our generate reports form to get back to it and then i’m going to double click in a blank area of our form to get back to our built-in class module which has all the code that we’ve created for this so far so we want to select the framework for the click event for your display command button so where it says user form at the very top of the module in the procedure list we’re going to do the drop down and we’re going to select cmd display so now we have private sub cmd display click event waiting for us because click is the default procedure for a command button i’m going to click after the opening and closing parentheses and press enter a couple of times and we’re going to tab and we’re going to type me dot hide and hide is on the list and in this instance as we saw previously when we used me it’s referring to the form when we click the display button it’s going to hide the form that’s one thing that we need to happen so now we’re going to declare some variables up top in the declaration section and we already have public sales and period as string click after period type a comma and type month so we have sales period and month as string variables press enter at the end of the as string line and we’re going to type public start date comma end date as date and press enter now we’re going to navigate to the end of this module and we’re going to create another sub procedure there that’s going to code the options selected in the period frame on the form and we’re going to use a select case construct here so at the very bottom of the module we’re going to type sub we’re going to name it get dates press enter a couple of times and then tab and i’ll scroll down so you can see my whole construct down there and we’re going to type select case period enter and then tab case and then in double quotes month enter tab month equals cbo month and we’ll type all of this in and then i’ll go over it and review it with you after i press enter after cbo month i’m going to shift tab so i get back to the case margin and i’m going to type case and then double quotes all enter tab start date equals get first date enter end date equals get last date enter shift tab case and then double quotes other so we have month all and other in our period frame enter and we’re going to do start date equals txt start date enter end date equals txt end date enter shift tab twice and you’re going to type end select and then i’m going to press enter again so i get that blank line between n select and end sub so let me break this down for you we’re doing a select case statement which is like an if then else if end if statement so we have three cases here right based on the period so case month means the month equals whatever month is selected in the combo box when they select all in that period frame the start date is going to equal the results of a function procedure that we don’t have in here yet called get first date and then the end date is going to equal the result of a function procedure that we also don’t have in here yet called get last date and then if they select other in the period frame the start date is going to be the start date that the end user puts in the start date text box and the end date will be the end date that the end user puts in the end date text box so that’s what we’ve created here in this get date sub procedure now the good news is the two procedures that we don’t have in here yet get first date and get last date we’re gonna bring in from a text file so we don’t have to type it and then we’ll review it so i’m going to click at the end of the end sub statement and press enter beneath our get date sub procedure and we’re going to go to insert menu file and this particular file that we want is going to be well we have get first date we’ll bring in the get last date first so we’re going to do get last date double click that file and then go to the end of that function after the end function statement be on the next blank line go back to insert file and we’re gonna insert get first date and so now let’s review these get last state and get first date functions we’ll start with get last date so we’re doing object variables here dim sheet as worksheet and then we’re just doing regular variables last date and test date we’re declaring those as dates so we’re starting with last date equals zero and we’re using a for each next construct so this is going to go through the worksheets for each sheet in worksheets the test state equals and it says see date and then in parentheses sheet.name so the name of the worksheets in this file are dates and see date is a conversion function that it’s going to convert the text date on the sheet tab into an actual date so let’s say it’s on the 26th of august 2016 sheet right it’s gonna convert the text on the sheet tab to a date format and assign it to the test date variable and then it says if test date is greater than the last date then the last date equals the test date and that’s in an if in if then end if construct which is nested in our for each next structure then it’s going to go to the next sheet and it’s going to repeat the process until there’s no more sheets and then it will determine what the last date is and so the result of the function get last date will be the last date that’s in the file and then get first date is similar right where we have our declarations and then it starts first date equals 99.99 well actually five nines and for each sheet it’s going to convert the sheet name date to a date and if the test date is less than the first date then the first date equals the test date and then it ends that if block with end if goes to the next sheet repeats the process until there are no more sheets now notice this one came in and the last line is red and if it’s not when you go to compile it’s going to be red because we declared first state and it’s all mushed together but in the text file it came in as two separate words so i’m going to just mush it together in that line and now we can compile and save so those two function procedures will determine the earliest date and the latest date in the workbook for the period frame at this point we have three more procedures that we’re going to need to do we’re only going to type one of them we’ll bring in the other two well actually we have four procedures we’re going to type one of them and bring in the remaining three from text files so we’re at the bottom of this module and we’re going to create a sub procedure under our get first state function procedure and i’m going to just type sub and i’m going to type get sales by grouping and press enter twice so this procedure is going to code the options in the sales frame on the form so it’s kind of like telling it if they select sales person in the sales frame what fields need to be in that pivot table report and so on and so forth so we’re going to do a select case statement for this i’m going to tab over type select case sales press enter and then tab case and then double quotes it’s going to be salesperson and on the form made that two words and then we’re going to press enter and tab so no page name which is the filter for the pivot table equals and then double quotes sales person and i’m going to check whether that needs to be separated there sometimes it’s what you called it on the form and then other times it’s the way it shows as a column header so i will definitely double check that before we test these procedures and then we’re going to do enter and we’re going to do row name equals and quotes year enter column name equals make and then our data name for our values in the pivot table report is going to equal selling price and i believe these are the headings on the spreadsheet we have a few more finishing touches we need to do in order to complete this process so we want to navigate to mod reports and go to the bottom of the module under our set fields sub procedure and we’re going to use a text file to bring in three other procedures so we’re going to go up to insert file and this time we want to consolidate data text file i did this as a text file because it actually contains three different procedures so we have a sub procedure named consolidate data then we have another sub procedure telling it where to start grabbing the cells and we have another sub procedure for finishing the report and just to kind of go over them briefly for you what these are doing so the consolidate data sub procedure will create a temporary worksheet in the file and name it reports and that will hold your pivot table report based on the option the user selects in the period frame it will collect the data from the worksheets this procedure calls a function that directs it to select the pertinent cells from each worksheet and if you look through it you can see the code blocks for that and they have select case statements and they’re using grab cells to grab some cells when it references grab cells it’s calling the sub procedure right underneath it named grab cells it’s passed an argument that is the beginning row number of the cells to be selected and it uses an if construct to grab all the cells on each worksheet that are applicable to the choices made in the form and then last but certainly not least we have a sub procedure named finish report and that moves the collected data from the reports worksheet into an existing workbook in the same directory named reports it then deletes the report worksheet in the sales fiscal year file and creates the pivot table in the reports workbook i should mention this by now we have created across different files multiple modules we also have an built-in class module for our form so you have lots of different blocks of code and what you want to do is as you’re working in visual basic you want to start saving your code blocks that actually work so after they’re tested and i have a code repository i just copy and paste my sub and function procedures into a word document because a lot of times you can reuse the same code over and over again you might have to just change a file name or something like that but why build it from the ground when you already know you have code that has worked before so i’ll make that suggestion here because especially some of these text files you’re getting really great code blocks to use in future vba projects we have just a few more finishing touches before we’ll test everything and this time we want to go to our built-in class module for our form so i’m going to just double click frm generate reports in the forms folder and then i’m going to double click a blank area of the form to get into that module we want to locate the click event for the display command button at the toward the top of mine i have private sub cmd display underscore click and currently it only has me hide in that sub procedure click at the end of me hide and press enter and now we’re going to use this to call other procedures we are going to call our get dates procedure enter get sales by grouping procedure enter consolidate data and we’re going to pass it up an argument of month so we can just put month after it consolidate data month and the finish report procedure and then we’re going to type unload me so when the the display button is clicked on the form it’s going to hide the form and it’s going to call those procedures get dates get sales by grouping consolidate data finish report and then it’s going to unload the form from memory now we have a modification we need to make in mod reports so we’re going to go back to mod reports and i’m going to use the procedure list to navigate to the set fields procedure we need to make a small modification there so when we created this set field sub procedure we did a number format but then when we created the get sales by grouping sub procedure for the selection in the sales frame if they select model we made color the data name so we made color to value field we don’t want the colors to be displayed with like a currency format really because it’s just going to be a count of color here we need to change this set fields procedure so it doesn’t put a numeric currency format on a color field if that’s what’s selected in the sales frame to adjust that if it is an actual value like a selling price value we do want it formatted in a currency format but if it’s account of models we don’t so we’re going to address that by using an if function so click at the end of the line that says activeworkbook.sheets reports dot activate and press enter and you’re gonna go ahead and tab and we’re gonna type if and then the name of our form frm generate reports dot sales and we’re going to use our not equal to so less than greater than and then in double quotes we’re going to type model if what they select in the sales frame on our form is not equal to model we wanted to go ahead and give it the currency format so we’re going to type then after model and then we’re going to come down to the line that has selection dot number format click at the end of that line and press enter and you’re going to tab and you’re going to type end if so it’s only going to apply a currency format if the selection in the sales frame is not model otherwise it won’t apply if it is model it won’t apply the currency format it’ll just be the number and we’re going to make a minor modification to our create pivot procedure so i’m going to use my procedure list to navigate to that one and then here in the set range data line we’re going to change the j1 range to i1 so when it consolidates all the data it’s only filling the column i we don’t need it to say j there so just another minor change and now we’re gonna go ahead and compile and save so two things we’re gonna do before we test this i promise that i would double check our sub procedure get sales by grouping it’s part of your built-in class module for your form to determine whether the salesperson case should be one word or two words it actually should be one word there so i’m gonna adjust that and i’m going to compile and save and then i’m gonna have you switch over to excel and delete the sheet tab that you created that you named reports which has the framework of the pivot table on it so just delete that sheet tab because it’s going to happen for us automatically when we test this and once you do that come back over to visual basic editor and we’re going to double click our form in the forms folder and then we’re going to press f5 to run this form we are going to select month in the period frame and then go down to the bottom right to your combo box and select july and in the sales frame we’re going to select sales person and then you’re going to go ahead and click your display button it’s going to click and were for a little bit on your screen and finally when it’s done now i’m getting a not responding message but that’ll clear we’ll see that a message box will pop up that says microsoft excel will permanently delete this sheet do you want to continue now notice it created that reports sheet tab for us and it just gathered all the information for the pivot table report so we’re going to tell it to delete this sheet and when i switch back over to excel you’ll notice that you’re in a whole different file this reports file has been sitting in the same directory as our sales fiscal year file and it was a file that was in the video description and what it did is first thing we’re going to look at is consolidate sheet tab so all the stuff that it gathered together for the selections in the form it put on the consolidate sheet tab and then it created the reports sheet tab where your actual pivot table report is showing so if we click on that pivot table report and you look at your fields list the sales person is being used as the filter field we have make in columns year in rows and the sum of the selling price in values and we’re going to close this reports file without saving the changes and you should still be in sales fiscal year and it doesn’t have a report sheet tab so we’re going to test this again using different selections on the form let’s do alt f11 to get back to our form and then we’re going to make sure it’s selected and press f5 to run it and this time we’ll we’ll still select month for and select july but this time in the sales frame we’re going to select model and now we’re going to choose display so again the clicking and wearing where it’s running all those procedures and gathering the data and you will ultimately get the message asking if you want to permanently delete this report sheet in sales fiscal year and we’re going to say delete and then when you switch back over to excel it is in that reports file and again if you look at the consolidate sheet it has all the data that was consolidated and then we go to the report sheet and this is where we put in that if statement because when we select model we said we don’t want the count of the models to be formatted as currency and you can see here or the count yeah of the model colors we don’t want them to be formatted as currency so they’re not they’re just the count of the colors per model and we can close the reports file without saving the changes so now we’re going to set up a way for the end user to display the form and make their choices without having to go into the code window so we’re going to add a button to the quick access toolbar that will show the form for the end user and the way we’re going to do that is we’re going to go up to the quick access toolbar and currently mine just has save on it and to the right of the save icon is a drop down arrow and when you select the drop down arrow you have a list of commands but toward the bottom you’re going to select more commands and it opens up the customize the quick access toolbar excel options window now on the right it defaults to customize quick access toolbar for all documents that’s the default well we want this button to only show in this document so we’re going to do the drop down next to for all documents and we’re going to choose for sales fiscal year and then what we’re going to do on the left side we’re going to access the drop down where it says choose commands from popular commands and when we do that drop down we see popular commands commands not in the ribbon all commands and macros we’re going to click on macros scroll down in this list until you see the show form macro we’re going to select it and then we’re going to click the add button so on the right you should just have show form sitting there for this particular document on the bottom right so you notice all of these macros have that same symbol right we’re going to change the symbol so with show form selected on the right underneath on the right you’re going to click on the modify button pick a symbol of your choice from the list of symbols that are showing there that you would like to have on the quick access toolbar for this so i always like to do different ones than the default ones i think for this one i’m going to just pick i’ll just pick the red circle no i’ll do the colorful butterfly just for fun so i’m going to click on the butterfly and click ok and now you’ll see the icon in front of show form and at the bottom you’re going to click ok so now you have that icon whichever one you selected on your quick access toolbar and when i click that icon it actually brings up the form so this is how the end users will be able to access the form and we can do cancel on our form and you’re going to go ahead and save your file to recap lesson 7 we started by recording two separate macros in excel to create a pivot table first the framework of the pivot table and then to create the fields that we want to use to populate the pivot table so two separate macro recordings then we went into visual basic for applications and we created a pivot table programmatically we had to create the pivot cache object first and then we could tell it to create the pivot table and we can do that in the same procedure but we had to do a separate procedure to set the fields for the pivot table just like we had to create create two separate macro recordings one for the framework of the pivot table and one to set the fields after that we spent some time finalizing our form by adding more code and we use some text files for some of the code that we added we then reviewed some of those text files and their procedures therein so you learned about the consolidate data procedure grab cells function and the finish report procedure and what they do in terms of the workflow here and then we modified our click event procedure for the display command button by calling all of the other procedures that we created or we created via text file and we added a line that said unload the form from memory once all of the other procedures have run we saw when we tested everything and we tested it a couple of times that it gathers all the data and puts it on a reports sheet tab in the sales fiscal year file and then it copies and pastes that data into a reports file in the same directory on its consolidate tab and then it creates the pivot table on another tab in the reports file and the pivot table displays the choices that were made on the form and we ended up adding code to a button on the quick access toolbar in excel and i selected the butterfly icon and that’s the way the user will launch the form to make their selections to get their pivot table reports created thank you for attending excel 2019 visual basic for applications video course hi everyone i’m trish connor cato welcome to the excel 2019 visual basic for applications video course this course is for beginning users looking to automate repetitive and recurring tasks in microsoft excel vba is microsoft’s programming language and it’s built into the office applications our focus during this course is on excel specifically you’ll be equipped with the basics to start writing your own vba code modify the code behind macros you’ve already recorded and have an understanding of how vba lends itself to creating efficiency in your daily tasks the course ends with you learning how to deal with code errors known as debugging and how to write error handling code if you’re enjoying these videos please like and subscribe if you want to earn certificates and digital badges please become a member of our patreon the link is in our video description if you have any questions you want answered by one of our instructors please join our off-site community the link is in the description as well as always if this course has exercise files you’ll find them in the video description below in the last lesson of this video course we’ll be focusing on debugging code we’ve already experienced some coding errors also referred to as bugs during this course as a matter of fact if we haven’t we could consider ourselves lucky as errors and coding go hand in hand typos will happen syntax may be overlooked math errors may occur and there are many more things that can cause code errors during program execution this lesson will introduce you to the three types of errors that can occur during execution and the reasons why they occur the process of tracing and correcting code errors is known as debugging the visual basic editor has a debug toolbar that can be used for this purpose we’ll also cover some tips for minimizing errors and what you can do if you cannot resolve them and you’ll see in this lesson why the structure of your code is important during the process of debugging code is easier to review when it’s organized in a logical structure so specifically we will be covering the following topics the types of coding eras and their causes using the debug toolbar to investigate errors and we’ll be setting breakpoints stepping through code using break mode during run mode and determining the value of expressions then we’ll move on to handling errors where you’ll gain an understanding of error handling and learning about vba’s error trapping options we’re going to get into trapping errors with the on error statement which includes understanding the error object writing an error handling routine and working with inline error handling as mentioned you’ll get tips for minimizing errors and tips on what to do if you cannot resolve them and finally you’ll be introduced to the object browser window and we’ll review more detail about that when we get there we’re going to be using our sales fiscal year file in this lesson there are only three types of eras that you may have in your visual basic for applications code so the first type is known as a logic error and these are the most difficult errors to locate and visual basic will not help you find them they’re usually caused by typos and logic errors will not stop your code execution instead you will have an unexpected outcome for example you may have used a minus sign instead of a plus sign and an expression so it will calculate the expression but you’ll get an unexpected outcome because of the wrong operator that’s being used then there are runtime errors a runtime error happens when a line of code cannot be executed the procedure is halted and a message box will display that defines the error there is a help button in the message box that can be used to view the help topic associated with that specific type of runtime era there are many types of runtime errors they’re caused by if you divide by zero that can’t be done if you reference a non-existent workbook or worksheet or other object and referencing an excel cell that contains an error are a few examples of things that can cause a runtime error and last but not least you have syntax errors now these are detected by the line editor and the compiler so as you’re typing code when you get to the end of a line and you press enter if there is a syntax error in that line the line will turn red and examples that can cause this are incomplete expressions and missing arguments and then syntax errors are also detected by the compiler so all along we’ve been compiling and then saving and the compiler checks all lines of code in each procedure and all declarations within the project a variable declaration is required if we have that option explicit statement at the top of a module the compiler will check that all variables are declared and that all objects have correct references to properties methods and events it also checks constructs to ensure the correct required statements are present so when you have a with block you need to have the end with statement when you have an if block you need to have end if the compiler will display a message box that describes the error if found so i mentioned using the debug toolbar in the visual basic editor to investigate errors the tools that are on that toolbar can be categorized as follows tools that help you manually execute the program tools that suspend the execution of the code and tools that assist in determining the values of expressions so there’s an illustration of the debug toolbar and its tools so the first set of tools would be the ones that could help you suspend the code and then you have a set of tools that can help you manually execute the program and that would start with like toggle breakpoint all the way through step out and then the last group of tools the window tools i call them are tools that assist in determining the values of expressions so this slide is for your future reference it’s just a further description of the debugging tools and their shortcut keys if any and a description a comprehensive description of each tool now most debugging is done when the application is suspended and that’s known as break mode an application is in break mode when a runtime error occurs a breakpoint is manually inserted into the code or a stop statement is entered within the code some of the tools for debugging can be utilized in design mode and or at run time in addition to when the application is in break mode so for example the step into tool can be run in break mode and design mode the immediate window can be run in brake mode design mode or at run time and the watch window can be run in brake mode and run time now before we do this next exercise i just want to review and i increase the size of the font for three of the tools on the debugging toolbar and those are the step tools so we used stepped into earlier in the course and we saw that that executed code one statement at a time one line at a time there’s also the ability to step over code and that would execute code one procedure or one statement at a time and then you have your step out option which can overlook a called procedure and execute the remaining lines of the calling procedure so you’ll get more experience with step into and you’ll get new experience with step out in this next lesson so we’re going to start by creating a syntax error and remember these would be detected by the line editor when you get to the end of the line and you press enter or by compiling your project which we’ve been doing all along and when you compile it compiles everything in the module we’re going to force this to happen i’m in the visual basic editor for sales fiscal year and then module one in the add totals procedure and what i’m going to do is i’m going to delete the end if statement and then i’m going to go up and compile the project now it gives me a compile error and it specifically tells me block if without end if so i can click ok and i’m going to put my end if statement back in and then i’m going to compile again and i don’t get the error let’s do another one in the if line we’re going to change the not equal to symbol to an exclamation point put an exclamation point there and now click out of that line and when you click out of that line the compile error comes up it says expect it then or go to and the entire line turns red we’re going to click ok and now go up and compile the project and this time you get a compiled error that says syntax error so this one’s a little bit more specific it’s letting you know there’s some kind of syntax error in that line and this is typical when you’re clicking out of the line it’s the same as pressing enter at the end of it and the line editor kicks in when you compile then the compiler kicks in this message is more specific i’m going to click ok and i’m going to change the exclamation point back to our not equal symbol and then i’m going to compile so now i’m in mod reports and i used my procedure list to get to the consolidate data procedure that’s one that we brought in from a text file and we’re going to go to the view menu hover over toolbars and click on debug so the debug toolbar comes up on the screen now we’re looking for a specific line of code and before we find it i’m going to decrease the width of the project explorer and properties panes on the left because we’re going to end up viewing this procedure side by side with the excel workbook after we set our manual break point so we’re going to scroll down in the procedure it says select case frm generate reports dot period when you find that line you can be anywhere within it and on the debug toolbar if you hover over the hand icon you’ll see that it says toggle breakpoint and it gives you the shortcut key which is f9 i’m going to just click the hand and it turns that line maroon and it puts a maroon oval in the gray bar to the left of the line that is indicative of a manual break point when you set a manual break point and you execute the code it will execute it up until the break point and then it goes into what’s known as break mode as you’ll see in a moment so i’m gonna arrange this so that my editor window is on the right side of my screen and i have my excel file on the left side of my screen and in the excel file i’m going to go ahead and start this procedure by running the show form procedure from the quick access toolbar so it’s going to bring up the form and in the period frame i’m going to select month and then choose august from the combo list and i’m going to select sales person in the sales frame and click display so if you notice on your excel screen the reports sheet has been created but it’s not populated and if you look at your editor screen now that line that where we set the manual breakpoint has yellow shading and a yellow arrow in the gray border to the left of it and so it ran all the code up until it gets to that line and now it’s in what’s called break mode now that we’re in break mode we can use our step tools i’m going to just display my debug toolbar again and your step tools are to the right of the hand so there’s your step into that does line by line you have step over which goes procedure by procedure or statement by statement and then you have step out that would skip any called procedures or just execute the rest of the code as one block so the first thing we’re going to do is step into and it goes down to the next line and we’ll do step over at this point that’s still within that for each block we’re going to step over again it goes down to compare which is another statement we’re going to step over again and it goes to the next statement and now go ahead and click on step out and it runs the rest of the code and you can see that it’s going through your excel workbook and ultimately you’ll get the pop-up asking if you want to permanently delete the report sheet in the sales fiscal year i’m going to go ahead and click delete and it opened the reports file and gave me my pivot table we’re going to go ahead and close the reports file and don’t save the changes and i’m going to just maximize the visual basic editor window again i’m going to expand my project explorer window so that i can get back to mod reports and notice it didn’t remove our break point so i’m going to click in that line and consolidate data procedure and go click the hand again to get rid of the break point and typically after using these processes i go ahead and click the reset button on the debug toolbar just to make sure there’s nothing lingering in memory you can go ahead and save so now i’m going to challenge you and give you an on your own exercise in the same consolidate data procedure i’m going to have you set the breakpoint again at the same line select case frm generate reports dot period and then i want you to execute the show form procedure until the program enters break mode so go ahead and pause the video and do those things at this point and i have my windows side by side again the program has halted execution at the point where it created the report sheet and now we can look at a couple of the window debug tools so with my debug toolbar to the right of your step tools are your window tools so the first one we’re going to select is the locals window and it opens in a pane on the lower half of the editor window and what it’s showing you is the current value of any variables if you look at mod reports under expression it has a plus sign when you expand it you’ll see your public variables and their values at this point it also on the right tells you the type of variable so the locals window will show you that when you’re in break mode and i just collapsed mod reports again and then what i’m going to do is i’m going to go ahead and press f8 so it’s at my break line i’m going to press f8 so it steps in to the code and i’m going to f8 until i get down to the on error resume next statement so now there’s a in the expression window the value of compare the compare expression is reports if i hover over compare in the code window you can see that it’s letting me know the value of that variable right in the code window when it’s in break mode in that compare line in the code window i’m going to have you select the function c date which is a conversion function right converts the date on the sheet tab the date the text string of the date on the sheet tab to an actual date so we’re starting with the letter c in c date and we’re going to highlight it until we get to the first closing parentheses after compare so just the function and its argument in parentheses is selected on your debug window the next to the last icon is quick watch another window so when we have that expression selected it gives us the context so it lets us know the vba project mod reports consolidate data procedure the expression itself and then its value is a type mismatch because there’s text on the sheet tab and then we’re converting it to a date so quick watch gives you different information than can show in your locals window and we’re going to close the quick watch window and you can use the x to close the locals window and now what you can do is you can go ahead step out of your code and i deleted the report sheet and i’m going to close the reports workbook without saving the changes and i’ll just maximize my editor window again we’re going to start forcing some runtime errors to happen and it is best practice to write error trapping code to try to avoid runtime errors you might not be able to avoid all of them but it will be helpful to avoid as many as possible error trapping options are set in the options dialog box in the editor where we set the required variable declaration earlier and changed our font size to review those options before we get into error handling they’re listed on this slide so there’s three options you can break on all errors so that means even if you’ve written error handling code a break in execution will occur if a runtime error is encountered so it really disables any error handling code that you’ve written break in class module the execution will break and an error message will display when an unhandled error occurs within a class module this option is only useful for debugging and then you have break on unhandled errors the execution will break and an error message will display when any unhandled error occurs and again we’ll review those options as we go over our next set of exercises there are some methods to error handling in visual basic for applications an on error statement is used to enable what’s called an error trap if an error is generated after this statement is executed the error handler becomes active and passes controlled to the code on the on error statement that it’s is specified and there are two types of on error statements on error go to and on error resume next i have the syntax so for on error go to then there’s a corresponding line label and then on error resumed x once an on error statement traps an error the error can be handled in one of three ways you could write an error handler this is a routine that is pointed to in the on error go to statement line label the line label statements address one or more types of errors for the procedure another method is ignoring the error and that’s what happens when you use the on error resume next statement to trap the error and handle it by moving to the next line of code and then you have inline error handling and that’s also on error resume next you can use it to trap the error you enter code in the procedure to check for errors after any statements that are expected to generate them you’ll see in the upcoming exercise that the error object can be used to examine information about an error that has just occurred the error object has a global scope and has properties and methods that are useful for finding out information about the current era clearing error information and generating errors the properties contain information about the error that just occurred in the current procedure so you have a number property and it’s the identification number of the most recent era and numbers represent different types of errors you have a description property which describes the error and corresponds to the error number and then you have a source property which is a name that identifies the component module and or procedure that generated the error and all three of those properties have data types as listed on this slide the error object only has two methods clear and raise clear resets all the error objects properties to zero or zero length strings this method is used automatically when any on error statement is encountered and then you have the raise method which generates a runtime error and it can specify the number of an error defined by vba excel or another application such as word and you’re like what is she talking about well it’ll start making sense when we start doing it which is going to be right now we’re going to start by causing a situation that will lead to a run time era so i’m in my working directory and what we’re going to do is we’re going to rename the excel file called reports we’re going to just name it reports with the number two and now i’m going to bring up my sales fiscal year file in excel i’m going to start the show form procedure from the quick access toolbar i’m going to select all for period and model in the sales frame and click display eventually you’ll get the runtime error has an error number 1004 sorry we couldn’t find my path reports.xlsx is it possible it was moved renamed or deleted and we’re gonna click the debug button on that message so it takes us over to mod reports to the sub procedure finish report and the error is being caused when it tries to execute that workbook dot open file name line because it’s looking for a file named reports now i’m gonna go up to the standard toolbar and i’m gonna click the reset button i’m going to go then go back to mod reports and notice that it cleared that break in the code for us so now before we write error handling code i want to show you the options that are available for you we saw them on the slide so i’m going to go up to the tools menu and choose options and when i get it in there at top i’m going to go to the general tab and on the right side you have your error trapping options so remember break on all errors really means ignore any error handling code that you would write your other choices are breaking class module or break on unhandled errors i usually use break on unhandled can’t really say usually it just depends on what kind of project i’m working on and i’m going to click ok to get out of there so now we’re going to modify this finish report sub procedure by using the on error go to statement so we’re going to click at the end of our variable declaration line dim sheet as worksheet press enter a couple of times and then you’re going to type on error go to and go to is one word here and then error handler in this example error handler is what we’re calling our line statement so on arrow go to error handler we’re going to go down and click at the end of the set fields called procedure and press enter and on this line we’re going to type exit sub and i’ll explain it after we get the rest of this in we’re going to press enter a couple of times and then we’re going to type error handler what we named our line label followed by a colon enter and we’re going to do a select case statement here so let’s select case and we’re going to do air dot and the list pops up and we’re going to select number so that’s a property of the air object so select case error num number enter tab and then we’re going to say case 1004 that’s the number of the runtime error we got so case 1004 enter tab message box and in parentheses and quotes the reports workbook is not available period close your quotes close the paren enter we’re going to out dent and we’re going to do case else enter tab message box again and this one is going to say error number we’re going to do a concatenated statement here colon space double quote our ampersand for concatenation air dot number again ampersand we’re going to do v b l f which is line feed we’re gonna do an ampersand and we’re gonna do our line continuation character of space underscore enter tab in double quotes error description colon space double quote space ampersand and air dot description so another property of the error object there and we’re going to close the parentheses we’re going to enter and out den until we get to the same margin as select case and we need our end select statement there and now we’ll break down what we just did so using on era go to what we’ve done is we said if there’s an error when this procedure runs go to our line so error handler is the line what we what we named it so if there is an error it’s going to go down and before it gets to that line it’s going to exit the sub procedure now this is only if there’s an error we don’t want it to try to keep running the sub procedure we wanted to exit the sub procedure and go to the error handler so we did a select case statement if the error number is 1004 it’s going to show a message box saying the reports workbook is not available if it’s a different error number it’s going to show a message box that gives the error number and then on the next line the error description both are pulled from the error object so that’s how you can trap this error go ahead and compile and save before we test this error handling code we need to switch back over to excel and delete the reports sheet tab confirm your deletion and now what we’re going to do is go ahead and launch the show form procedure again i’m going to select the same selections all model and display and this time instead of getting a runtime error we get our pop-up because it was era number 1004 the reports workbook is not available you can go ahead and click ok on that message box now this time we’re going to leave the reports sheet here and what i’d like you to do is go back to your working directory and rename reports to back to reports and then come back over here to your sales fiscal year file now that we have the file renamed we’re going to set up a situation where we will use inline error handling by using the on error resume next statement in your file go ahead and launch the show form again and this time i’m going to select month and choose july and i’ll just do salesperson in the sales frame and display we’re getting runtime era another 1004 that name is already taken try a different one and we’re going to select debug so it brings us to the consolidate data sub procedure where activesheet.net equals reports well remember when we’re running this procedure it has been creating the report sheet for us it’s already there so we’re getting this runtime error because you can’t have two sheet names with the same name reports we’re going to go ahead and use our reset button on the toolbar and i’m going to make my way back to mod reports and i’m still in the consolidate data procedure and after our variable declarations we are going to press enter after dim sheet as worksheet a couple of times and we’re going to type on error resume next and then we’re going to go down to the line that says activesheet.name equals report click at the end of it and press enter a couple of times and tab and we’re going to type an if statement here so if and then air dot number equals 1004 then enter and tab active sheet dot delete sheets on the next line and then parentheses double quotes reports dot cells dot select enter selection dot clear enter air dot clear that’s the clear method of the error object so clear out the error enter and then i’m going to shift tab to out dent and type my end if statement and you want to go ahead and compile and save so because the report sheet was already there when it ran this it created a new sheet so if i go look at excel i have this empty sheet three and so what this is saying and that’s the active sheet if after it goes to activesheet.name equals report and it gets that error it’s going to say active sheet delete which is that generic sheet and then it’s going to select the report sheet and all of its cells and clear everything off of that sheet and then it’s going to clear the era as well so that’s what this one is going to do let’s switch over to excel and the first thing we’re going to do is get rid of that extra sheet before the report sheet just delete it and go ahead and launch your form and we’ll do month july again here and i think i’m going to do model and display so now it’s letting us know that it’s going to delete this sheet now i’m on sheet 4 and we’re going to select delete to confirm it and then it’s going to go through the process and you’ll get your second delete prompt to delete the reports sheet and now you have your reports workbook open with the pivot table that one covers the case of if you forget to delete the report sheet from sales fiscal year we are trapping the era and resuming the rest of the code you can close the reports workbook without saving the changes so i promised you some tips for minimizing errors and also some tips on what to do if you can’t resolve an error i’m going to just stop talking and let you review this slide hopefully some of these tips will help you avoid errors and some of what to do if you can’t resolve them these are from my personal experience oftentimes if i ask someone else to look at my code or i’m explaining the issue i’m having with it the explanation will become clear to me during that process or someone else might look at it and instantly see what’s causing the era the object browser allows you to browse through all available objects in your project and see their properties methods and events in addition you can see the procedures and constants that are available from object libraries in your project you can also get online help as you browse in the object browser so you’ve already noticed some icons in the editor environment particularly in the list that are displayed and you’ll see those icons in the object browser window as well so i’ve given you a table here with the icons and what they represent within the visual basic editor i can go to the view menu and choose object browser its shortcut key is f2 and so it opens kind of like in its own window and notice at the top it says all libraries if you do the drop down there you could just see the excel library or the microsoft forms library or office or vba or vba project i’m going to select vba project and so this is our project and what it’s showing on the left side under classes these are the objects that are in our vba project so it’s showing all those worksheets and it’s showing our form if i click on frm generate reports then it shows you things so these are properties events methods it’s our objects our controls like month and period and sales those are our frames so you’re seeing everything that’s in your project as i continue to scroll down i see the click event for the cancel button and the display button so you’re seeing events properties all of those things and methods that make everything kind of work together and some of those properties we didn’t use on the objects on our form like we didn’t use the print form property but it’s available because it’s in the vba project library so if i click on cmd display click on the right hand side and i look almost at the bottom of the screen it just lets me know that it’s a private sub procedure and it’s a member of the form generate reports that we created and you can feel free to explore the object browser if there’s anything in there that you want more information on you can click on it and then you’ll have your help icon up here in the upper right so you can explore help topics from in here as well and to close the object browser i’m going to use the second close window the smaller one in the upper right hand corner of the screen to close the object browser our last topic in this course concerns how to protect your code so if you have end users using this excel file and they have the developer tab or they know how to switch over to visual basic for applications editor you may not want people to be able to access your code so you can password protect it it’s kind of a two-step process so you’re gonna go in the visual basic editor you’re gonna go to the tools menu and you’ll notice on the list you have an option for vba project properties let’s click it there are two tabs you’re on the general tab you’re gonna go to the protection tab and you’re gonna check the box that says lock project for viewing and then you have to give it a password and confirm it for training purposes i’m going to just use the word train and all lowercase and i’m going to click ok and then i’m going to save now you’re going to have to close both visual basic and your excel file for this to take effect so go ahead and close both of these windows and then reopen your sales fiscal year macro enabled file once you have your file reopened you can alt f11 to get back into the visual basic editor if you expand your sales fiscal year vba project you’ll see that it prompts you for your password and those who do not have the password will not be able to see the objects forms and modules and access them so again once you set your password you need to save and enclose vba and excel and reopen the file for that password protection to take effect to recap this lesson we started by going over the different types of coding eras and their causes you learned how to use the debug toolbar to investigate errors we set breakpoints we used our step debugging tools we entered break mode during run mode and we used the locals window and quick watch to determine the value of expressions and variables when it comes to handling errors we got an overview of error handling and vba’s error trapping options and then we moved on to trapping errors with the on error statement we learned about the error object and its methods and properties we wrote an error handling routine by using on error go to with a line handler and we also worked with inline error handling um actually sorry i got the mat opposite the error handling routine was the on error resume next and the inline error handling was on era go to we reviewed some tips for minimizing errors and what to do if you can’t get them resolved we did a quick tour of the object browser when you’re new to vba that can be very helpful so you can learn about different properties and methods that are available for different objects and then we end it with password protecting your code thank you for attending excel 2019 visual basic for applications video course thanks for watching don’t forget we also offer live classes and office applications professional development and private training visit learned.com for more details please remember to like and subscribe and let us know your thoughts in the comments thank you for choosing learn it [Music] you

    By Amjad Izhar
    Contact: amjad.izhar@gmail.com
    https://amjadizhar.blog

  • Building a Library App with Next.js, PostgreSQL, and More

    Building a Library App with Next.js, PostgreSQL, and More

    This text details the creation of a full-stack web application for a university library. The application features user authentication, book browsing, and borrowing functionality. The backend uses PostgreSQL with Neon for a serverless database and Drizzle ORM for efficient data management. Frontend technologies include Next.js, Shadcn UI, and Tailwind CSS. Additional services integrated are Upstash for caching and workflows, ImageKit for asset management, and Resend for email delivery. The development process is described step-by-step, highlighting best practices and problem-solving.

    University Library App Study Guide

    Quiz

    Instructions: Answer the following questions in 2-3 sentences each.

    1. What is the purpose of using Tailwind CSS in this application?
    2. Explain the role of shaten/ui in the app’s development.
    3. What is Neon and how is it utilized in this project?
    4. What is an ORM, and why is Drizzle chosen for this application?
    5. What is the function of Upstash Redis in the app’s architecture?
    6. Describe the purpose of Upstash Workflows within this project?
    7. Why is rate limiting implemented in the authentication process, and how does Upstash facilitate this?
    8. How are emails sent using Resend, and why is this tool chosen?
    9. Explain the functionality of the Imagekit service in this application.
    10. Describe the purpose of the borrowing functionality and the database interaction associated with it.

    Quiz Answer Key

    1. Tailwind CSS provides a way to style the application with full flexibility, using pre-defined utility classes, similar to writing regular CSS, but more quickly and efficiently. It enables a consistent look and feel across all components.
    2. shaten/ui is a library that provides pre-built components, like buttons or forms, that can be easily customized using Tailwind CSS. These components allow for quicker development and standardization of the app’s interface.
    3. Neon is a serverless PostgreSQL database that provides instant provisioning and easy integration with the project’s stack. It simplifies the process of using a PostgreSQL database by removing the need for complicated configurations.
    4. An ORM (Object-Relational Mapping) is a tool that allows developers to interact with databases using objects, rather than writing SQL queries. Drizzle was chosen because it is designed for modern TypeScript developers, offering type safety and easy use.
    5. Upstash Redis provides low-latency data storage and retrieval, which is ideal for tasks like caching, session management, and real-time data needs. In the app, it is used to fetch books quickly and implement rate limiting.
    6. Upstash Workflows enables the automation of multi-step tasks, such as onboarding new users or managing data processing. In this app, it is used to automatically send emails, check user inactivity, and manage book borrowing deadlines.
    7. Rate limiting prevents DDOS attacks by restricting the number of requests a user can make in a given timeframe. Upstash Redis is used to keep track of requests and enforce the limit.
    8. Emails are sent using Resend, a tool that allows for customized email templates using React components. It is used in this application for sending welcome emails and reminders to users who have been inactive.
    9. Imagekit is a tool that enables the optimization and transformation of images and videos, providing a central hub for efficiently managing assets. It allows for faster load times and easy management of visual content.
    10. The borrowing functionality allows users to borrow a book, which initiates a database mutation for tracking purposes. This also uses a newly created “borrow records” table which tracks which users borrowed which books, when they borrowed them and when their return date is.

    Essay Questions

    Instructions: Answer each question in a multi-paragraph essay format.

    1. Discuss the importance of using a modern tech stack when developing web applications. How does the specific stack used in this library app contribute to its scalability, maintainability, and performance?
    2. Analyze the role of serverless technologies in the development of the University Library app. How does the use of Neon, Upstash, and Vercel contribute to the app’s overall architecture and operational efficiency?
    3. Compare and contrast using an ORM such as Drizzle with using native SQL for database interactions. What are the advantages and disadvantages of each approach for this specific project?
    4. Explain the importance of both client-side and server-side components in Next.js applications. How does the architecture of the University Library app utilize these components and balance the benefits of server-side rendering with client interactivity?
    5. Describe the processes for implementing both authentication and authorization in this project. How are server actions used to manage user data and maintain data security?

    Glossary of Key Terms

    API (Application Programming Interface): A set of rules and protocols that allows different software applications to communicate with each other.

    bcrypt: A password hashing function used to securely store passwords in a database.

    Caching: The process of storing frequently accessed data in a temporary storage location to improve retrieval speed.

    CSS (Cascading Style Sheets): A style sheet language used for describing the look and formatting of a document written in a markup language.

    DDOS (Distributed Denial of Service) Attack: A cyberattack in which the perpetrator seeks to make a machine or network resource unavailable to its intended users by temporarily or indefinitely disrupting services.

    Drizzle: An open-source ORM (Object-Relational Mapping) designed for modern TypeScript developers.

    ESLint: A tool for identifying and reporting patterns found in ECMAScript/JavaScript code.

    Imagekit: A free tool for quickly optimizing and transforming videos and images.

    JWT (JSON Web Token): A standard for securely transmitting information between parties as a JSON object.

    Neon: A serverless PostgreSQL database service.

    Next.js: A React framework for building web applications, enabling server-side rendering and other performance optimizations.

    ORM (Object-Relational Mapping): A technique that lets you query and manipulate data from a database using an object-oriented paradigm.

    Prettier: A code formatter used to ensure consistent code style and readability.

    Rate Limiting: A technique used to limit the number of requests a user can make within a specific time frame.

    Redis: An open source, in-memory data structure store, used as a database, cache, message broker, and streaming engine.

    Resend: A service that provides APIs for sending transactional emails.

    Shaten UI: A library of customizable components that can be easily integrated into a Tailwind CSS project.

    SQL (Structured Query Language): A domain-specific language used in programming and designed for managing data held in a relational database management system.

    Tailwind CSS: A utility-first CSS framework that allows for rapid styling of web applications.

    TypeScript: A superset of JavaScript that adds static typing to the language.

    Upstash: A serverless data platform offering a variety of services including Redis, Workflows and Vectors.

    Vercel: A cloud platform for frontend developers that allows for serverless deployment of web applications.

    University Library Application Development

    Okay, here is a detailed briefing document summarizing the provided source:

    Briefing Document: University Library Application Development

    Overview:

    This document summarizes the development process of a University Library application, focusing on the technologies, features, and key decisions involved in its creation. The project emphasizes building a scalable, production-ready application using industry-standard, open-source tools. The approach includes detailed explanations and demonstrations, aiming to teach not just replication of the specific application, but the broader use of these technologies for future projects.

    Key Themes & Technologies:

    1. Modern Frontend Development:
    • Next.js: Chosen as the core framework for the application, offering features like server-side rendering and an app router for a smoother user experience.
    • “Next JS will now automatically install all of the dev dependencies needed for us to run our project very easily”
    • TypeScript: Used to ensure a well-structured and maintainable codebase, with a commitment to explaining its usage for newcomers.
    • “I’ll later explain the many benefits you’re getting by using typescript and and don’t worry if you haven’t used tab script before”
    • Tailwind CSS: Selected for styling applications due to its flexibility and utility-first approach.
    • “It allows you to have full flexibility of how your applications are going to look like it’s just like you’re writing Reg CSS you have all the properties at your disposal but you can use them in a quicker way by simply using a set of predefined utility classes”
    • Shadcn UI: A component library that provides pre-built components styled with Tailwind CSS, enhancing the visual consistency and standardization of the application.
    • “a library that allows you to copy some of the components but then use the full power of Tailwind CSS to style them to your liking”
    • Prettier and ESLint: Utilized to maintain code cleanliness and enforce best practices, ensuring a scalable and well-maintained codebase.
    • “we want our codebase to be scalable well structured and maintained”
    1. Robust Backend & Database:
    • PostgreSQL: Chosen as the database for its advanced capabilities and open-source nature, managed with Neon for ease of use.
    • Neon: Provides a serverless PostgreSQL database with features like instant provisioning and integration with Next.js, simplifying the setup and scaling process.
    • “It allows you to use open- Source postgress databases with many features that make it such a breeze to use you get instant provisioning no waiting no config and it configures directly with your stack”
    • Drizzle ORM: Implemented to make database architecture scalable and production-ready by simplifying database interactions with its type-safe and easy-to-use design.
    • “an object relational mapping tool which will allow you to make your database architecture that much more scalable and drizzle is definitely the way to go nowadays”
    1. Asset Management & Optimization:
    • ImageKit: A free tool used for optimizing and managing images and videos within the application, ensuring efficient media handling.
    • “It is a free tool allowing you to quickly optimize and transform your videos and images and just have a central Hub where you can efficiently manage all of the assets for your project”
    1. Advanced Features for Production Readiness:
    • Upstash Redis: Used for low-latency data storage and retrieval, beneficial for caching, session management, and real-time applications.
    • “a service that offers low latency data storage and retrieval perfect for caching session management and real-time applications”
    • Upstash Workflows: Employed to manage and automate multi-step tasks such as onboarding, data processing, email notifications, and user activity tracking.
    • “allowing you to manage and automate multi-step tasks great for things like onboarding or handling data processing workflow flows”
    • Rate Limiting: Implemented using Upstash to prevent denial-of-service attacks and ensure fair usage of the application.
    1. User Experience and Authentication:
    • Next-Auth (Oauth): Used for handling user authentication, employing a credentials provider for custom email/password login logic.
    • “import next OD we get a lot of things out of it like the signin functionality sign out off and more and we can choose which providers to add”
    • Custom Email Templates: Resend is used for sending emails, allowing the use of React components for custom email templates, enhancing the design and customization options.
    • “you can completely write your email templates using react components that is not possible with simpler tools like email JS”

    Key Features Demonstrated:

    • User Authentication: Full sign-up and sign-in flows with validation, including image uploads.
    • “when you visit the website for the first time you’ll see the signin screen if you’re creating a new account you can go to the signup page where you’ll have to fill in a lot of information all of it fully validated we also have an image upload with completion percentage”
    • Automated Workflows: Onboarding processes such as welcome emails, inactivity checks, and notifications.
    • “the moment you’ve created an account our server triggered an onboarding workflow sending you a welcome email but that’s not the best part another part of the onboarding workflow is inactivity checks so if you don’t visit the website for the next 3 days you’ll get another automated email prompting you to check it out”
    • Book Management: Displaying detailed book information, including descriptions, author, copies, and videos, with filtering, searching, and pagination.
    • “there’s this library page where you can see a full list of books available in the library with pation boort and you can easily search for any book or filter it through your liking and if you click on any of these books you’ll go to its Details page where you can see complete information from Total and available copies description trailers summaries and more”
    • Borrowing System: Implementing a borrowing process with account approval for users, and managing book availability.
    • “if you click on borrow book you’ll see a destructive toast saying you can’t borrow a book until your account gets approved Yep this is what we’re doing we’re not letting just anyone visit the website and try to borrow a book instead we’ll allow admins to approve their account”
    • Rate Limiting: Preventing abuse and ensuring stable service availability.

    Important Ideas and Facts:

    • Emphasis on Industry Standards: The project is built using technologies and practices commonly found in production environments.
    • Practical Learning: The approach prioritizes understanding how to build scalable applications, not just replicating this specific project.
    • Serverless Architecture: The utilization of Neon and Upstash for serverless databases, simplifying infrastructure management.
    • Open Source Focus: All tools and technologies utilized are open-source, promoting accessibility and community contributions.
    • Importance of Rate Limiting: Protecting applications against malicious activity with Upstash Redis.
    • Power of Workflows: Automating tasks and user engagement with Upstash Workflows.
    • Customizable Email Templates: Using Resend to send emails with fully customizable design.

    Conclusion:

    This project demonstrates a comprehensive approach to building a production-ready application using modern technologies and best practices. The emphasis on scalability, automation, and user experience makes it a valuable learning experience for aspiring developers. The detailed explanations provided throughout the project aim to empower users to not only build this application, but also apply the knowledge to their own future projects.

    Building a Scalable University Library Application

    FAQ: Building a Scalable University Library Application

    1. What technologies are used to build this application?

    This application leverages a variety of modern, production-ready technologies. For styling, it uses Tailwind CSS for flexibility and utility classes, along with Shadcn UI for pre-built components that are customizable. The database is PostgreSQL, accessed through Neon, which provides a serverless experience. Drizzle ORM is employed for scalable database architecture, and ImageKit manages assets like images and videos. Finally, Upstash Redis is used for caching and workflows. The app is also built using Next.js, Typescript, and ESLint, Prettier.

    2. How does user onboarding work in this app?

    The application automates the onboarding process. When a user creates an account, a welcome email is sent. The system also includes inactivity checks, triggering automated emails if the user doesn’t visit the website for a few days, or a congratulations email if they are using the app. Account approval by an administrator is required before book borrowing is enabled, similar to university admission processes. This system leverages Upstash’s workflows.

    3. What are the benefits of using TypeScript in this project?

    TypeScript provides several benefits to this project, such as type checking which helps to catch errors early on in development, and improved code maintainability as the project gets larger. It also provides strong typing when defining the database schemas through drizzle, allowing for more reliable data models.

    4. Why is rate limiting important, and how is it implemented in this application?

    Rate limiting is crucial for preventing denial-of-service (DDOS) attacks. It restricts the number of requests a user or IP address can make within a specific time frame. In this application, rate limiting is implemented using Upstash Redis. When a user exceeds the limit, they are redirected to a “Too Fast” page.

    5. How are emails handled in this application, especially for onboarding and notifications?

    Email functionality is handled by Resend. The application uses Resend to send welcome emails upon signup and to notify users if they haven’t been active in a while. These emails are created with react component templates, allowing for fully customized designs. The email logic is set up with Upstash workflows.

    6. How are images and videos managed within this application?

    Images and videos are managed using ImageKit, which provides a centralized hub to efficiently optimize, transform, and manage assets. This includes features like progress tracking during uploads, file size validation, and rendering optimized assets on the front end of the application.

    7. How is the database set up and what role does Drizzle ORM play?

    The database is set up using Neon, a serverless Postgres service, which allows for easy provisioning and scaling without complex configurations. Drizzle ORM acts as an object-relational mapping tool, which enables interaction with the database using typesafe, clean, and easy-to-use code. Drizzle allows for database schemas to be defined with JavaScript rather than using raw SQL, which simplifies the development process. Drizzle is also used to generate and manage migrations for SQL databases.

    8. How is user authentication implemented, and is there a user role system?

    User authentication is implemented using NextAuth.js, with a custom credential provider for email and password. There isn’t the concept of social login with google and github implemented in this specific course. The application includes a basic user role system, with users having a “pending,” “approved,” or “rejected” status, and a role of either “user” or “admin”. Admin roles are required to create new book records in the database. Users also have an activity check, allowing the system to prompt them with emails if they are inactive after a specific period of time.

    Full-Stack Library Management System

    The sources describe the development of a full-stack library management system. The system consists of two interconnected applications: a public-facing app for users and an admin interface. The apps are built using a monorepo architecture. The development process emphasizes industry-standard practices and real-world application demands.

    Key aspects of the app development include:

    • Technology Stack:
    • Next.js with TypeScript for building web applications.
    • Tailwind CSS for styling, along with Shadcn UI for pre-built components.
    • PostgreSQL database, managed with Neon and Drizzle ORM for efficient database interactions.
    • Upstash for caching, rate limiting, and workflow automation using Redis.
    • ImageKit for real-time media processing and asset management.
    • Resend for email communications.
    • Oauth.js for authentication.
    • Public Facing App:
    • Open-source authentication with personalized onboarding flows and emails.
    • Homepage featuring a highlighted book and newly added books with 3D effects.
    • Library page with advanced filtering and pagination.
    • Book detail pages that track availability and show summaries, videos, and similar books.
    • Profile page to manage accounts, track borrowed books, and download receipts.
    • Admin Interface:
    • Analytics dashboard displaying statistics on new users and book borrows.
    • User management including all users and account requests pages where admins can approve or revoke access.
    • Book management pages with forms for adding and editing books and detail pages.
    • Borrow request management.
    • Key Features and Functionality:
    • Rate limiting to protect against DDOS attacks.
    • Caching optimizations for faster data retrieval.
    • Multimedia uploads and management.
    • Advanced error handling.
    • Automated workflows with custom notifications, such as onboarding emails, borrowing deadlines, and reminders.
    • Complex database queries using Drizzle ORM.
    • Image and video optimization using ImageKit.
    • Form validation using React Hook Form and Zod.
    • Server actions for secure server-side operations.
    • Database migrations for managing database schema changes.
    • Development Process:
    • The project started as a simple tutorial but evolved into a production-ready application.
    • The development was broken down into steps with explanations of concepts.
    • The tutorial includes not just the final code but the approach to building such an application, such as setting up the tech stack.
    • The process includes UI development, database setup, and integration of various tools and libraries.
    • Production Readiness:
    • The application uses a serverless PostgreSQL database.
    • The application includes rate limiting to prevent abuse.
    • The application uses automated workflows for email notifications.

    The sources provide a comprehensive overview of how to build a sophisticated, production-ready application using modern web development technologies and practices. The process is iterative, starting with UI components, then integrating with a database, and finally implementing advanced features like authentication, rate limiting, and automated workflows.

    Full-Stack Library Management System Database Interactions

    The sources detail extensive database interactions within the full-stack library management system, covering various aspects such as setup, schema design, querying, and data manipulation. Here’s a breakdown of the key database interactions:

    • Database Choice and Setup:
    • The system uses PostgreSQL as its primary database.
    • Neon is utilized to manage the PostgreSQL database in a serverless environment. Neon offers features like instant provisioning, autoscaling, database branching, and APIs.
    • The database connection string is configured using environment variables.
    • Object-Relational Mapping (ORM):
    • Drizzle ORM is used to interact with the database, chosen for its type safety and ease of use with TypeScript.
    • Drizzle simplifies database interactions and allows for more scalable database architecture.
    • Drizzle also provides a studio for exploring and manipulating data.
    • Schema Definition:
    • Database schemas are defined using Drizzle’s syntax in TypeScript, which is then translated into SQL.
    • The schema includes tables for users, books, and borrow records.
    • The users table includes fields for user authentication, personal information, and account status. It also includes enums for the user’s status and role.
    • The books table includes fields for book details, such as title, author, genre, rating, cover, description, and number of copies.
    • The borrow records table tracks which users borrowed which books, along with borrow and due dates.
    • Unique identifiers (uid) are used as primary keys.
    • The schemas use data types such as integer, text, varchar, uid, date, and timestamp.
    • Data Manipulation:
    • Drizzle’s methods like select, insert, update, and delete are used to perform database operations.
    • The application fetches data using queries that include conditions, limits, and ordering.
    • Data is inserted into tables using the insert method, which takes values to be added and returns the inserted record.
    • The update method modifies records based on specified conditions.
    • Database queries are type-safe, ensuring that data is correctly structured.
    • Data is often limited to specific numbers of records and filtered using the where clause.
    • Database Migrations:
    • Drizzle Kit is used to generate and apply database migrations.
    • Migrations are used to manage changes to the database schema over time.
    • Commands like drizzle kit generate and drizzle kit migrate are used to create SQL migration files and apply them to the database.
    • The migrations are stored in a dedicated folder.
    • Seeding Data:
    • A script is used to seed the database with initial data, such as dummy books.
    • The seeding process involves reading data from a JSON file and inserting it into the database using Drizzle.
    • The script handles uploading images to ImageKit and then inserting book information into the database using Drizzle.
    • The seeding process includes uploading the images and video of the books to image kit and using those URLs to populate the database.
    • Transaction Management:
    • The source doesn’t explicitly detail transaction management, but it does imply the use of transactions with Drizzle ORM for data integrity.
    • Specific Database Interactions:
    • User authentication involves querying the database for users based on email and password.
    • User data is updated when users log in or interact with the application.
    • Admin users are identified by querying the database to check their role.
    • Book borrowing involves checking book availability and then updating both the books and borrow records tables.

    These database interactions are crucial to the library management system’s operation. The use of Drizzle ORM, coupled with Neon and PostgreSQL provides a robust and scalable approach to data management. The system also uses a secondary database (Redis through Upstash) for caching, rate limiting, and workflows. This shows how multiple databases can be used together in a single system to enhance performance and efficiency.

    Library Management System Authentication

    User authentication in the library management system is a critical component, designed to ensure secure access and manage user roles effectively. Here’s a detailed overview of how authentication is handled, based on the sources:

    • Authentication Method:
    • The system uses email and password for authentication.
    • The implementation is based on OAuth.js (next-auth), a free and open-source library for handling authentication in Next.js applications.
    • The system also implements JSON Web Tokens (JWT) for session management.
    • Credentials Provider:
    • A custom credentials provider is set up to manage the authentication logic.
    • The provider handles user sign-up and sign-in processes.
    • It validates credentials by checking if an email and password are provided.
    • It fetches user data from the database, based on the provided email.
    • Password Handling:
    • User passwords are hashed before being stored in the database for security.
    • The bcryptjs library is used for password hashing and comparison.
    • Sign-up Process:
    • The sign-up process involves collecting user information, including full name, email, University ID, password, and a university ID card image.
    • The system performs full validation of the sign-up form.
    • New users are added to the database with a default status of “pending” and a role of “user”.
    • Upon successful sign-up, a welcome email is sent to the user using an automated workflow.
    • After creating a new user, the system also automatically signs the user in.
    • Sign-in Process:
    • The sign-in process involves validating the email and password against the stored user credentials.
    • The system uses the credentials provider to check for the validity of the password and retrieve user data.
    • If the credentials are valid, the user is signed in and a session is created.
    • Session Management:
    • The system uses JWT for session management, which is configured within the next-auth config file.
    • The JWT is populated with the user’s ID and name.
    • A session provider is used to manage user sessions across the application.
    • The session is populated with the currently logged-in user data, making it accessible to components.
    • User Roles:
    • Users can have different roles, such as “user” and “admin”, which determine their permissions.
    • The user’s role is stored in the database and checked when accessing certain parts of the application.
    • Admins have access to the admin dashboard and can manage users, books, and other aspects of the library system.
    • The system ensures that only admin users can access the admin dashboard.
    • Authentication Logic:
    • The authentication logic is implemented within the auth.ts file located in the root directory.
    • This file configures OAuth.js and specifies how to interact with the database.
    • Server Actions:
    • Server actions are used for secure server-side operations, such as signing up and signing in users.
    • These actions are executed on the server, ensuring that sensitive data and operations are protected.
    • Rate Limiting:
    • Rate limiting is implemented using Upstash Redis to protect against brute force attacks and DDOS.
    • The system limits the number of requests from a single IP address within a given time frame.
    • Users who exceed the rate limit are redirected to a “too fast” page.
    • Logout:
    • A logout function is implemented to terminate the user session.
    • The logout button is placed at the top right in the header.
    • Redirects:
    • The system includes redirects to ensure that users are properly directed to the sign-in page if they are not logged in.
    • Similarly, users who are logged in are redirected to the homepage from the sign-in page.
    • Admin users that try to access the admin interface are redirected to the public app, unless their role is set to “admin”.
    • User Activity Tracking:
    • The system tracks the last activity date of the user and stores it in the database.
    • This information is used to send emails to users that have been inactive for a period of time.
    • The system updates the user’s last activity date once per day to limit database mutations.

    This comprehensive approach to user authentication ensures that the library management system is secure, user-friendly, and well-equipped to manage different user roles and interactions effectively.

    Workflow Automation with Upstash Qstash and Resend

    Workflow automation is a key aspect of the library management system, designed to streamline various processes and enhance user engagement. The system uses Upstash Qstash workflows to manage these automated tasks. Here’s a breakdown of how workflow automation is implemented:

    • Workflow Management:
    • Upstash Qstash is used as a serverless platform for managing and automating workflows.
    • Qstash allows for the creation of durable, reliable, and performant serverless functions.
    • The workflows are designed to be resilient to failures and can pick up where they left off in case of temporary outages.
    • They support long-running executions, making them suitable for complex tasks such as data processing or sending email notifications.
    • Workflow Endpoints:
    • Workflow endpoints are defined as a set of steps, each containing a piece of business logic.
    • These endpoints are created within the Next.js API directory, typically under a /workflows route.
    • The routes contain the logic for triggering and managing workflow actions.
    • Workflow Client:
    • A workflow client is created to trigger the workflows.
    • This client uses the Upstash Qstash URL and token to connect to the Qstash service.
    • The client is used in the application’s server actions to start the defined workflows.
    • Onboarding Workflow:
    • The system implements a customer onboarding workflow as an example, which is triggered when a new user signs up.
    • The workflow includes steps such as:
    • Sending a welcome email to new users.
    • Waiting for a specified period of time (e.g., 3 days) before further actions.
    • Checking the user’s activity state periodically.
    • Sending different emails based on user activity status (active or non-active).
    • The onboarding workflow logic is defined within the /api/workflows/onboarding/route.ts file.
    • Email Notifications:
    • The workflows are integrated with Resend, an email API for developers, to send emails.
    • The emails are sent using the publishJson method provided by Qstash, which is integrated with Resend.
    • The workflow sends emails based on specific conditions, such as when a user signs up, has been inactive for 3 days, or is active.
    • Custom email content, including the subject and the message, is set using parameters passed to the sendEmail function.
    • The emails are sent from a custom domain that has been verified with Resend.
    • User Activity Checks:
    • The system checks for user activity by tracking the last activity date in the database.
    • The user’s activity state (active or non-active) is determined based on a custom function which checks if the time difference between the user’s last activity date and the current date is greater than a certain threshold.
    • If a user has not been active for a specified period (e.g., 3 days), an email notification is sent to prompt them to visit the website.
    • If the user has been active, they might receive a newsletter or a welcome back email.
    • The activity checks are done periodically, and appropriate actions are taken based on the state.
    • The user’s last activity date is updated only once per day to limit database mutations.
    • Workflow Triggering:
    • Workflows are triggered by calling the workflowClient.trigger method.
    • The trigger method includes the URL of the workflow endpoint, as well as any required parameters (e.g., email and full name of the user for the onboarding workflow).
    • The onboarding workflow is triggered immediately after a new user signs up through the auth.ts action file.
    • Customizable Workflows:
    • The workflow logic is highly customizable and can be tailored to specific application needs.
    • The email content, scheduling intervals, conditions, and user state checks can be modified as required.
    • Workflows can be used for many types of automations, including on-boarding, notifications, reminders, data processing, and more.
    • Code Implementation:
    • The core workflow logic is implemented within the lib/workflow.ts file, which contains the workflow client and the email sending logic.
    • The workflow endpoint logic is implemented in the /app/api/workflows/onboarding/route.ts file.
    • The lib/actions/auth.ts file contains the server action that triggers the workflow.

    This workflow automation system allows for a more dynamic and engaging user experience by providing timely notifications and ensuring that users are prompted to return to the platform when necessary. The combination of Qstash workflows with Resend emails provides a flexible and reliable solution for automating various business processes within the library management system.

    Production-Ready Library Management System

    The library management system is designed with several features that contribute to its production readiness, ensuring it can handle real-world demands and maintain a high level of performance and security. Here’s a breakdown of the key aspects:

    • Scalable Architecture:
    • The system is built using a monorepo architecture, which allows for the management of two interconnected applications (the public-facing app and the admin dashboard) within a single repository.
    • This structure promotes code sharing, consistency, and easier management of the entire application.
    • The use of Next.js as the framework enables the creation of high-quality web applications with the power of React components, making the app scalable and performant.
    • Modern Tech Stack:
    • The system utilizes a modern tech stack including Next.js, TypeScript, Tailwind CSS, Shadcn/ui, PostgreSQL (with Neon), Drizzle ORM, Upstash Redis, ImageKit, and Resend.
    • These are all industry-standard, open-source, and production-ready technologies.
    • TypeScript is used to ensure a scalable and maintainable code base.
    • Tailwind CSS and Shadcn/ui are used for efficient and flexible styling of the application.
    • Database Management:
    • PostgreSQL, powered by Neon, is used as the primary database, which allows for a serverless setup, auto-scaling, and database branching.
    • Drizzle ORM is used to interact with the database, making database operations faster and simpler.
    • The system employs database migrations, which are generated based on the schema defined in the code, to manage database changes effectively.
    • Data seeding is implemented to populate the database with initial sets of data for testing and development purposes.
    • Caching and Rate Limiting:
    • Upstash Redis is used for efficient caching, session management, and rate limiting.
    • Rate limiting is implemented to prevent DDOS attacks and brute force attempts by limiting the number of requests from a specific IP address within a given time frame.
    • The system redirects users to a “too fast” page if the rate limit is exceeded.
    • Media Management:
    • ImageKit is used for real-time media processing APIs, asset management, and optimizing images and videos.
    • ImageKit provides dynamic transformations, storage, and streaming capabilities, which are perfect for delivering media assets to any device.
    • Automated Workflows:
    • Upstash Qstash workflows are used to manage automated tasks like sending emails, checking user activity, and managing book borrowing notifications.
    • Workflows are used to implement user onboarding flows, which involve sending welcome emails and checking for user inactivity.
    • The system uses Resend for sending emails, allowing for custom email templates built with React components.
    • Authentication and Authorization:
    • The system uses OAuth.js for secure authentication, which manages sign-up, sign-in, and user sessions.
    • JSON Web Tokens (JWT) are used for session management.
    • User roles are used to define permissions, ensuring that only admins can access the admin dashboard.
    • Bcryptjs is used for password hashing and comparison, providing a more secure way to store passwords in the database.
    • Error Handling:
    • The system implements comprehensive error handling using try and catch blocks, console logs, and descriptive toast notifications for both users and developers.
    • The system uses loaders and performance optimization to handle errors gracefully without blocking other parts of the application.
    • Deployment:
    • The application is deployed using Vercel, ensuring scalability and reliability.
    • The system utilizes environment variables for configuration management, which are set up in both local and production environments.
    • The system separates development and production environments to avoid conflicts.
    • UI and UX Design:
    • The user interfaces are designed to be modern, polished, and easy to navigate, using Tailwind CSS and Shadcn/ui.
    • The system uses toast notifications to provide feedback to the user during different actions, including sign-up, sign-in, and form submissions.
    • The design is responsive and user-friendly, providing a consistent user experience across different devices.
    • The application uses loading states to show progress for actions like image uploads and book borrowing.
    • Code Quality and Practices:The codebase is well-structured, scalable, and maintained using Prettier and ESLint.
    • The system uses clear coding practices with meaningful variable names and comments.
    • The system promotes code reusability and creates reusable components, such as the file upload component, which can be used for different input types.

    These elements collectively ensure the library management system is not just a functional application, but a production-ready solution that adheres to industry standards and best practices. The system is designed to be scalable, secure, and easily maintainable, providing a solid foundation for future growth and feature additions.

    Build and Deploy a Fullstack App with Admin Dashboard | Next.js, PostgreSQL, Redis, Auth.js

    By Amjad Izhar
    Contact: amjad.izhar@gmail.com
    https://amjadizhar.blog

  • Ollama Course – Build AI Apps Locally

    Ollama Course – Build AI Apps Locally

    This course teaches users how to leverage the open-source tool, olama, to run large language models (LLMs) locally on their personal computers. The instructor, Paulo, covers olama’s setup, customization, REST API integration, and Python libraries. Several practical applications are demonstrated, including a grocery organizer, RAG system, and AI recruiter agency. The course emphasizes hands-on learning alongside theoretical concepts, requiring basic programming and AI knowledge. Key features highlighted include model management, a unified interface, and cost efficiency through local execution.

    Ollama Local LLM Applications Study Guide

    Quiz

    Instructions: Answer each question in 2-3 sentences.

    1. What is Ollama and what is its primary function?
    2. According to the course, why is it beneficial to run large language models locally?
    3. What are RAG systems and how do they relate to large language models?
    4. What are parameters in the context of large language models, and how do they impact performance?
    5. Describe the role of context length in a large language model.
    6. What does the term “quantization” refer to in relation to LLMs?
    7. What is a model file and how can it be used with Ollama?
    8. How can the Ollama REST API be utilized?
    9. What is the purpose of Langchain in building AI applications with Ollama?
    10. Briefly explain how Ollama agents can be leveraged to build more complex applications?

    Answer Key

    1. Ollama is an open-source tool designed to simplify the process of running large language models locally on your personal computer. Its main function is to manage the installation, execution, and customization of these models, making advanced AI accessible to a wider audience.
    2. Running large language models locally with Ollama offers benefits such as being free, providing more control over models, and ensuring better privacy since your data does not need to be sent to external servers. This approach allows you to experiment without relying on cloud-based services.
    3. RAG systems, or Retrieval Augmented Generation systems, combine document retrieval with large language models to enhance the models’ knowledge. They work by retrieving relevant information from a knowledge base to augment the prompt so that the LLM can provide responses grounded in your specific data.
    4. Parameters in large language models refer to the internal weights and biases the model learns during training. More parameters generally mean a more complex model with a greater capacity to understand and respond accurately, but also require more computational resources.
    5. Context length refers to the maximum number of tokens a large language model can process at once in a single input. A longer context length allows the model to handle larger documents, conversations, and can capture dependencies across text spans.
    6. Quantization is a technique used to reduce the size of a neural network model by reducing the precision of its weights. This leads to smaller models, faster processing, and lower memory usage.
    7. A model file is a configuration file used in Ollama to customize a large language model. It allows developers to modify parameters like temperature and system messages, tailoring the model to perform specific tasks.
    8. The Ollama REST API provides an interface to interact with Ollama models through HTTP requests. It allows developers to programmatically generate responses, manage models, and use them in applications without needing the command line interface.
    9. Langchain is a framework that simplifies building applications with large language models. It provides tools to load documents, generate embeddings, manage vector databases, and create chains of operations to manage the complexities of LLM applications.
    10. Ollama agents, similar to AI agents in general, are components that act autonomously to complete a specific task or a complex series of steps, often using large language models and other tools. They can be used to create complex workflows such as resume analysis or automated recruiting processes.

    Essay Questions

    Instructions: Answer each question in a well-structured essay format, citing relevant details from the course material.

    1. Discuss the benefits and drawbacks of running large language models locally compared to using cloud-based services. What trade-offs should developers consider when making this decision?
    2. Explain the process of building a RAG system using Ollama, emphasizing the roles of different components like embedding models, vector databases, and large language models. How does Langchain contribute to the development of these systems?
    3. Compare and contrast using the Ollama CLI, the REST API, and a UI-based interface for interacting with large language models. What scenarios are each most suited for and why?
    4. Describe how a model file can be used to customize a large language model within Ollama. Provide examples of how changes to settings like temperature and system messages can impact model output.
    5. Analyze how AI agents and autonomous systems can be used to build complex workflows with Ollama. Discuss the design considerations and benefits of adopting agent-based approaches for specialized tasks.

    Glossary

    Agent: In the context of AI, an agent refers to a software component that can operate autonomously to complete a specific task or series of tasks, often leveraging large language models.

    API (Application Programming Interface): A set of protocols, routines, and tools for building software applications. In this context, it refers to the REST API offered by Ollama for programmatic interaction with LLMs.

    CLI (Command Line Interface): A text-based interface for interacting with a computer program or operating system, in the case of Ollama, it provides direct access to the models through commands.

    Context Length: The maximum number of tokens an LLM can process at once in a single input. A longer context length allows the model to handle longer texts and capture dependencies more effectively.

    Embeddings: Numerical vector representations of text or other data that capture the semantic meaning and relationships between different pieces of data. Used to allow computers to perform computation on linguistic data.

    Extensibility: Refers to the ability to add custom models or extensions to Ollama.

    Hallucination: A phenomenon in LLMs where the model generates information that is factually incorrect or does not align with the provided context, often sounding confidently correct.

    Langchain: An open-source framework for developing applications with large language models. Provides a unified abstraction for loading documents, embedding, and managing vector databases.

    LLM (Large Language Model): A machine learning model trained on a vast amount of text data, capable of understanding and generating human-like text.

    Model File: A configuration file used in Ollama to customize LLMs. It allows developers to modify parameters like temperature and system messages, tailoring the model to specific tasks.

    Multi-Modal Model: A type of LLM that can understand and process multiple types of data, such as text and images.

    Ollama: An open-source tool that simplifies running large language models locally on a personal computer. It manages model downloads, execution, and customization, allowing advanced language processing without external services.

    Parameters: The internal weights and biases learned by a neural network during training. They determine how the model processes input data and generates output. More parameters generally indicate a more complex model.

    Quantization: A technique used to reduce the size and computational demands of a neural network model by reducing the precision of its weights.

    RAG (Retrieval Augmented Generation): A system that combines document retrieval with large language models. It enhances the model’s knowledge by retrieving relevant information from a knowledge base, and allowing the model to give informed responses.

    REST API (Representational State Transfer API): A way to interact with web services by sending HTTP requests, the REST API for Ollama allows interaction with LLMs without the command line.

    Vector Database (Vector Store): A database that stores data as vector embeddings, specifically designed to handle similarity search.

    Olama: Local LLM Development Course

    Okay, here’s a detailed briefing document summarizing the key themes and ideas from the provided text about the Olama tool and its associated course:

    Briefing Document: Olama – Local LLM Development

    Introduction:

    This document reviews a mini-course focused on using Olama, an open-source tool that enables the local running of large language models (LLMs) on personal computers. The course, created by Paulo deson, aims to teach developers and other interested individuals how to leverage Olama for building AI solutions without relying on paid cloud services. The course emphasizes a hands-on approach balanced with theoretical understanding.

    Main Themes and Key Ideas:

    • Olama: Local, Free LLMs: Olama is presented as a solution to the problem of accessing and using large language models, which often involves paid cloud services. It allows developers to download, run, and interact with various LLMs locally on their machines for free. “The idea here is very simple as you know right now if you want to run large language models or if you want to use a model large language model in this case just a model most likely you’ll have to use open Ai chbt and so forth and many others out there that are paid and the thing is with a Lama you don’t have to pay for anything it’s free and that’s the beauty.”
    • Simplified LLM Management: Olama simplifies the process of managing, installing, and executing different LLMs via a command-line interface (CLI). It abstracts away the technical complexities involved in setting up and running these models. “ama abstracts away the technicality so the technical complexity that are involved when we want to set up these models which makes Advanced language processing accessible to a broader audience such as developers researchers and hobbyists”
    • Local Control and Privacy: By running models locally, users maintain control over their data and ensure privacy, as data is not sent to external servers. This addresses the data privacy concerns associated with cloud-based LLM services. “in this case here when we run our own models locally uh we are making sure that our data doesn’t need to be sent to external servers”
    • Key Features of Olama:
    • Model Management: Easy download and switching between various LLMs.
    • Unified Interface: Consistent set of commands for interacting with models.
    • Extensibility: Support for adding custom models and extensions.
    • Performance Optimizations: Effective utilization of local hardware, including GPU acceleration.
    • Use Cases:
    • Development and Testing: Testing various LLMs to determine optimal performance for specific applications.
    • RAG (Retrieval Augmented Generation) Systems: Building RAG systems powered by local models for information retrieval and context-aware responses. “the idea is that we’re going to be able to build rag system so retrieval augmented generation systems that are powered solely by AMA models”
    • Privacy-focused Applications: Ensuring data privacy by running models on local hardware.
    • Course Audience: The course is targeted towards developers, AI engineers, open-minded learners, machine learning engineers, and data scientists who are interested in local LLM application development. It assumes a basic understanding of programming, particularly Python, as well as general knowledge of AI, machine learning, and LLMs. “this course is for developers AI Engineers open-minded Learners machine learning engineers and so forth as well as data scientists so if you are somebody who is willing to put in the work and wants to learn about AMA and build local llm applications then this course is for you”
    • Course Structure: The course includes a mix of theory and hands-on learning, with an emphasis on practical application. It begins with the fundamentals and then transitions to hands-on projects where students build AI solutions using Olama. “most of my courses I have this mixture of two things I have Theory so this is where we talk about the fundamental concepts the lingo and so forth and I have Hands-On because it’s all about actually doing things that way you actually understand and know how to get things done that’s the whole point”
    • Development Environment: Requires Python installed, a code editor (VS Code is recommended), and a willingness to learn. “in this case you know that this is all P about python which means you’ll have to have python installed and also you have to have some sort of a code editor”
    • Olama Installation and Usage: The course demonstrates how to install Olama on different operating systems (MacOS, Linux, Windows). It also shows how to download and run models, and how to interact with them through a command-line interface.
    • Understanding Model Parameters: The course touches upon important model parameters, such as parameters (3.2B, 1B), context length, embedding length, and quantization. It clarifies that a higher number of parameters improves accuracy, but increases the computational requirements. “when we talk about parameters talk about 3B or 2B or 10p or 7p and so forth these are numbers inside a neural network that it adjusts to learn how to turn inputs into correct outputs”
    • Olama Commands: The course introduces several key Olama commands like list, remove, pull, run, and the use of the model file for customizing models.
    • Rest API: The course demonstrates that behind the command line interface there is a rest API that you can interact with to get responses.
    • UI based Interface: The course introduces a third party tool called mistral which allows you to interact with AMA models through a UI.
    • Python Library: The course also explores the use of Olama through a Python library, which makes it easier to integrate Olama into applications. “we want to be able to create local large language model applications using AMA models and so for that we need a way for us to be able to use python”
    • Practical Applications:
    • Grocery List Organizer: Creating a tool that categorizes grocery items from a plain text list.
    • RAG Systems: Building a full RAG system using Langchain, allowing users to interact with their own documents. “we’re going to build rack systems with AMA so with AMA of course we can build more complex large language model applications”
    • AI Recruiter Agency: Developing an AI-powered recruitment tool for processing resumes and providing candidate recommendations using an agent-based system.

    Key Quotes:

    • “olama is an open-source tool that simplifies running large language models locally on your personal computer”
    • “the idea is that we’re going to be able to use AMA to customize our models meaning that we are able to use different flavors of models so we can test them around and all of that is actually going to be free”
    • “the idea is that ama sits at the center and allows us developers to pick different large language models depending on the situation depending on what we want to do”
    • “the main point here of of course is that we have this Model Management in one place we’re able to easily download and switch between different large language models”
    • “the idea is that you find something that will work for you”
    • “AMA as we know is a platform that allows you to run large language models locally which is really awesome”
    • “AMA model support these tasks here text generation code generation and multimodel applications”
    • “the power that we have right now is at all this is locally”
    • “we have our own box that we can pass in sensitive documents and all those things without worrying about prices”
    • “the great thing here is that it supports various models tailored for different tasks including text generation code generation and multimodel applications”
    • “we can now use sort of a a backend combination of the API rest API through the python Library the AMA python library”
    • “agents is a really good way to build complex applications”

    Conclusion:

    This course provides a comprehensive introduction to Olama, demonstrating its potential for local LLM development. By emphasizing hands-on experience and practical applications, the course equips developers with the knowledge and skills needed to create AI solutions that respect privacy and reduce costs. The course demonstrates the practical applications of Olama for tasks such as building a grocery list categorizer, creating RAG systems, and building a complex AI agent based application.

    Ollama: A Guide to Local LLMs

    Frequently Asked Questions about Ollama

    • What is Ollama and what problem does it solve? Ollama is an open-source tool designed to simplify the process of running large language models (LLMs) locally on your own hardware. It addresses the problem of needing to rely on paid cloud-based services like OpenAI or complex setup procedures when using LLMs. By abstracting away technical complexities, Ollama makes advanced language processing accessible to a broader audience such as developers, researchers, and hobbyists, providing a free and private alternative to cloud services.
    • Who is this course about Ollama for? This course is tailored for developers, AI engineers, open-minded learners, machine learning engineers, and data scientists who are willing to put in the work to learn about Ollama and build local LLM applications. It assumes a basic understanding of programming (especially Python) and some fundamental knowledge of AI, machine learning, and LLMs.
    • What are some key features of Ollama? Ollama has several key features including:
    • Model Management: Easily download and switch between different large language models.
    • Unified Interface: Interact with various models using one consistent set of commands through the command-line interface (CLI).
    • Extensibility: Supports adding custom models and extensions.
    • Performance Optimizations: Effectively utilize your hardware, including GPU acceleration where available.
    • What are parameters in the context of large language models? Parameters are the internal weights and biases that a model learns during training and determine how the model processes input data and generates output. The number of parameters (e.g., 3.2B) reflects the complexity and capacity of the model, with more parameters typically leading to better performance but also requiring more computational resources. Models like Llama are designed with efficiency in mind, performing well even at smaller scales.
    • What are use cases for Ollama? Ollama has a wide range of use cases, including:
    • Development and testing: Allows developers to test and switch between models when creating applications.
    • Building retrieval augmented generation (RAG) systems: Enables the creation of free, local rag systems.
    • Privacy-focused data processing: Keeps data locally, eliminating the need to send information to external servers.
    • Custom AI solutions: Allows building tailored large language model applications with free models and control over your data and environment.
    • How do you install and run models with Ollama? To install Ollama, you download the appropriate version for your operating system (MacOS, Linux, or Windows). Once installed, you can download and run specific models directly using the CLI, e.g., ollama run llama3:latest to get the latest llama 3 model. Models are managed through the CLI, which allows for downloading, removing, and listing available models. You can then interact with the models directly through the terminal shell.
    • Can Ollama models be customized, and how is that done? Yes, Ollama models can be customized by creating a model file, where you can specify model parameters, such as temperature, and system messages. You can create a new version of an existing model using the ollama create command, which uses your defined model file to implement the desired customization, allowing you to fine-tune your models for specific purposes.
    • Besides the CLI, how else can you interact with Ollama models? Ollama models can also be interacted with using the REST API, accessible at localhost:11434 when Ollama is running. The REST API allows you to generate responses, chat with models, or fetch metadata using tools like curl and JSON payloads in python. Additionally, user-friendly interfaces like the Mistral app allow you to interact with locally running Ollama models with a GUI, making it similar to using ChatGPT, and integrating with document knowledge bases via retrieval augmented generation (RAG). In addition, code libraries such as python, provide an abstracted way of interacting with the REST API, which will make building LLM applications using your own models locally even simpler.

    Olama: Local Large Language Model Toolkit

    Olama is a tool that simplifies running large language models locally on a personal computer [1, 2]. It is an open-source tool designed to make advanced language processing accessible to a broader audience, including developers, researchers, and hobbyists [2].

    Olama’s applications include:

    • Building local large language model applications: Olama allows users to customize models and build applications using them [1].
    • Creating retrieval augmented generation (RAG) systems: Olama enables the creation of RAG systems powered by its models [1].
    • Model management: Olama allows users to easily download and switch between different large language models [3].
    • Development and testing: Developers can test applications that integrate large language models without setting up different environments [3].
    • Education and research: Olama provides a platform for learning and experimentation without the barriers associated with cloud services [3].
    • Secure applications: Olama is suitable for industries where data privacy is critical, such as healthcare and finance, because models are run locally [4].
    • Customization: Olama allows for greater flexibility in customizing and fine-tuning models [5].

    Olama addresses the challenges of accessibility, privacy, and cost in the realm of large language models [4]. By enabling local execution, it makes AI technologies more practical for a range of applications [4].

    Specific real-world applications include:

    • Grocery list organizer: Olama can categorize and sort grocery items [1, 6].
    • AI recruiter agency: Olama can be used to build an AI-powered recruitment agency that extracts information from resumes, analyzes candidate profiles, matches candidates with suitable positions, screens candidates, and provides detailed recommendations [1, 7-9].

    Olama supports various models tailored for different tasks, including text generation, code generation, and multimodal applications [10]. Olama can be used through a command line interface (CLI), a user interface (UI), or a Python library [11].

    Key features of Olama include:

    • Model management: The ability to easily download and switch between models [3].
    • Unified interface: Interacting with models using a consistent set of commands [3].
    • Extensibility: The ability to add custom models and extensions [3].
    • Performance optimization: Utilization of local hardware, including GPU acceleration [3].
    • Cost-efficiency: Eliminating the need for cloud-based services and associated costs [5].
    • Reduced latency: Faster response times due to local execution [5].
    • Enhanced privacy and security: Data does not need to be sent to external servers [5].

    Olama uses a command line interface (CLI) to manage model installation and execution [12]. The tool abstracts away the technical complexity involved in setting up models, making it accessible to a wider audience [12].

    Local LLMs with Olama: Accessibility, Privacy, and Applications

    Local Large Language Models (LLMs) can be run on your personal computer using tools like Olama, an open-source tool that simplifies this process [1]. Olama is designed to make advanced language processing more accessible for developers, researchers, and hobbyists [2].

    Key aspects of local LLMs and their applications include:

    • Accessibility: Olama makes it easier for a broad range of users to utilize LLMs, without requiring specialized knowledge of machine learning frameworks [2].
    • Privacy and Security: Running models locally means that your data is not sent to external servers, which enhances privacy and security [3]. This can be especially important for applications dealing with sensitive information [4, 5].
    • Cost-Efficiency: Local LLMs eliminate the need for cloud-based services, which means you don’t have to pay for API calls or server usage [4].
    • Reduced Latency: Local execution of models reduces delays associated with network communications, leading to faster response times [4].
    • Customization: You have greater flexibility in customizing and fine-tuning models to suit specific needs without limitations from third-party services [4].
    • Model Management: Olama provides a central place to download, manage, and switch between different LLMs [6].

    Olama uses a command-line interface (CLI) to manage models, which abstracts away technical complexities [3]. Olama also has a REST API that can be used to interact with models [7].

    Applications of local LLMs using Olama include:

    • Building local LLM applications, with the ability to customize models [1].
    • Creating Retrieval Augmented Generation (RAG) systems [1]. RAG systems use documents or data to generate responses, thereby augmenting the knowledge of the LLM [3].
    • Development and testing of applications that integrate LLMs [6].
    • Education and research, providing a platform for learning and experimentation [5].
    • Secure applications in industries like healthcare and finance, where data privacy is crucial [5].
    • Creating tools that use function calling, which aids LLMs in performing more tasks [8].
    • Customizing models for specific purposes [4].

    Olama supports a variety of models tailored for different tasks including text generation, code generation, and multimodal applications [9].

    Examples of real-world applications include:

    • Grocery list organizers that can categorize and sort items [1, 10].
    • AI recruiter agencies that can extract information from resumes, analyze candidate profiles, match them to positions, screen them, and provide recommendations [1, 11, 12].

    In summary, local LLMs, especially when used with tools like Olama, provide a way to utilize large language models in a private, cost effective and flexible manner [2, 4]. They allow for the development of various applications across diverse fields by allowing people to use LLMs locally [4].

    Olama: Customizing Local LLMs

    Model customization is a key feature when using local large language models (LLMs) with tools like Olama [1]. Olama is designed to allow users greater flexibility in modifying and fine-tuning models to better suit their specific needs, without being limited by third-party services [1].

    Here’s a breakdown of how model customization works with Olama:

    • Flexibility: Local execution of models allows for greater flexibility in customizing models [1]. You can adjust models to meet specific requirements without the constraints imposed by third-party services [1].
    • Fine-tuning: Olama enables the fine-tuning of models to better suit specific needs [1].
    • Model Files: Model files allow for modification and customization of models. These files contain specific instructions and parameters for the model. For example, you can set the temperature of a model, which influences its creativity or directness, and add system messages to instruct the model on how to behave [2, 3].
    • Creating Custom Models: With Olama, you can create customized versions of models by specifying a base model and adding parameters through model files [3]. This process allows you to tailor a model’s behavior to your specific needs [3].
    • Extensibility: Olama supports adding custom models and extensions [4]. This allows you to integrate models or functionalities that are not available in the standard Olama library [4].
    • Parameters: You can customize a model by adjusting parameters like temperature which affects the creativity of the model [3]. The system message parameter, for example, can instruct the model to be succinct and informative [3].
    • Model Management: Olama provides a central place to manage different models which can be used interchangeably. You can easily download and switch between different large language models, allowing for testing and selection of the model that best suits your needs [4, 5].

    Practical examples of model customization include:

    • Adjusting model behavior: By using a model file, you can instruct a model to be more succinct and informative [3]. This is useful in a variety of applications where you need specific responses from the model [3].
    • Creating specialized models: You can use a base model and customize it to create a model designed for a specific purpose [3]. This is helpful when you need a model with a focused skill set for a specific task [3].
    • Testing and switching models: Olama makes it easy to switch between different models to determine which one performs best for a particular use case. You can test various models to find the one that works for you [4, 5].
    • Adapting to different tasks: You can switch between models tailored for various tasks including text generation, code generation, and multimodal applications. You can select the best model for the task you want to perform [6].

    By allowing this level of customization, Olama makes it possible to tailor LLMs to very specific applications. The ability to modify models, combined with local execution, provides a versatile way for developers and researchers to use the power of LLMs in various settings [1].

    Retrieval Augmented Generation Systems

    Retrieval Augmented Generation (RAG) systems are a way to enhance the capabilities of large language models (LLMs) by allowing them to access and use external data sources to generate responses [1, 2]. This approach helps to overcome some limitations of LLMs, such as their limited knowledge base and tendency to “hallucinate,” by providing them with relevant, up-to-date information from a custom knowledge base [2, 3].

    Here’s how RAG systems work:

    • Indexing:
    • Document Loading: Documents in various formats (e.g., PDF, text, URLs, databases) are loaded into the system [4].
    • Preprocessing: The loaded documents are parsed and preprocessed. This typically involves breaking the text into smaller, manageable chunks [2-4].
    • Embedding: These text chunks are converted into numerical representations called embeddings using an embedding model [2-5]. These embeddings capture the semantic meaning of the text, allowing for similarity comparisons [4, 6].
    • Vector Storage: The generated embeddings are stored in a vector database or vector store, which is designed for efficient storage and retrieval of these high-dimensional vectors [2-4, 7].
    • Retrieval and Generation:
    • Query Embedding: When a user asks a question (the query), that question is also converted into an embedding using the same embedding model [2, 4, 5].
    • Similarity Search: The query embedding is used to search the vector database for the most similar document embeddings [2, 5, 6]. This search retrieves the most relevant chunks of text related to the query [4, 5].
    • Context Integration: The retrieved document chunks and the original query are combined and passed to the LLM [2, 3, 5].
    • Response Generation: The LLM uses the provided context and the query to generate a coherent and informed response [2, 3, 5].

    Key components of RAG systems include [7]:

    • Large Language Model (LLM): The core component responsible for generating the final response [7]. It leverages its knowledge, reasoning capabilities and is good at predicting things, summarizing and brainstorming [3].
    • Document Corpus: The collection of documents that serve as the knowledge base for the system [7].
    • Embedding Model: Used to convert both the document chunks and the queries into vector embeddings [2-4].
    • Vector Database: A specialized database for storing and efficiently searching through the vector embeddings [2-4, 7].
    • Retrieval Mechanism: The process that identifies and retrieves the most relevant document chunks in relation to the query [7].
    • Prompt Engineering: Designing prompts that effectively instruct the LLM on how to utilize the provided context to generate answers [8, 9].

    Tools like LangChain can simplify the development of RAG systems [7]. LangChain provides abstractions for document loading, splitting, embedding, and integration with various LLMs and vector databases.

    Benefits of RAG systems:

    • Enhanced Accuracy: RAG systems provide LLMs with external context, which reduces the occurrence of generating responses that are not based on any supporting information [2, 3].
    • Up-to-Date Information: By using external knowledge bases, RAG systems can provide more current information than the LLM might have been trained on [3].
    • Customization: RAG systems can be tailored to specific domains or use cases by using domain-specific documents [2, 3].
    • Reduced Hallucination: The use of external data helps the LLM to avoid making up information [2, 3].
    • Improved Transparency: Since the LLM is grounded in retrieved data, it’s easier to trace the source of its answers [5].

    Olama can be used to build RAG systems with local LLMs [1, 2]. By enabling local execution of both LLMs and embedding models, Olama provides a cost-effective and private way to build RAG systems [1, 2, 10]. Olama also supports various models that can be used for both embeddings and language generation, allowing for flexibility in the development process [11].

    In summary, RAG systems combine the knowledge and reasoning capabilities of LLMs with the specificity of external data sources. These systems are useful when you need an LLM to reason about specific, custom or up-to-date information. This approach enhances the performance of LLMs in many different application scenarios [5, 7].

    AI-Powered Recruitment Agencies

    AI can be used to build recruitment agencies using tools like Olama and the swarm framework, which allows for the creation of AI agents that perform tasks delegated to them [1, 2]. This setup can automate many parts of the recruitment process, drawing on the power of large language models (LLMs) and AI [2].

    Here’s how AI recruitment systems work:

    • AI Agents: Specialized AI agents are created to perform different tasks in the recruitment process [2]. Each agent is designed with specific instructions and capabilities, and can delegate tasks to other agents [2-4].
    • Base Agent: All agents are built from a base agent, which has the core functionalities needed for the agent to work, such as the connection to the local LLM [3, 5].
    • Task Delegation: Agents delegate tasks to other agents, allowing for a structured and efficient workflow.
    • Local LLMs: Local LLMs, powered by tools like Olama, are used in the backend, eliminating the need for API calls and third party services [1, 3, 5].

    Key agents in an AI recruitment system include [4, 6-8]:

    • Extractor Agent: Extracts information from resumes, focusing on personal information, work experience, education, skills, and certifications [6, 7]. It converts the raw text into a structured format.
    • Matcher Agent: Matches candidate profiles with job positions based on skills, experience, location, and other criteria [7, 8]. It uses the extracted information from the resume and available job listings to find suitable matches.
    • Screener Agent: Screens candidates based on qualifications, alignment, experience, and other factors, generating a screening report [6].
    • Profile Enhancer Agent: Enhances candidate profiles based on the extracted information [8].
    • Recommender Agent: Generates final recommendations based on the analysis, extracted information and other factors [4].
    • Orchestrator Agent: Coordinates the entire recruitment workflow, delegates tasks to other agents, manages the flow of information, maintains context, and aggregates results from each stage [4, 9].

    Here are the steps in an AI recruitment system:

    • Resume Upload: A resume is uploaded to the system [2, 10].
    • Information Extraction: The extractor agent extracts information from the resume [6, 7, 10].
    • Analysis: The orchestrator sends the extracted information to the analyzer agent [9, 11].
    • Matching: The matcher agent compares the extracted resume information with available job listings to identify potential matches [7, 8].
    • Screening: The screener agent performs a screening of the candidate, generating a report [4, 6].
    • Recommendation: The recommender agent provides final recommendations [4].
    • Result Output: A comprehensive report is generated with a breakdown of skills, job matches, and recommendations.

    This system can provide:

    • Skill Analysis: A detailed analysis of a candidate’s skills, expertise, and experience [10, 11].
    • Job Matches: Identification of potential job matches based on skills and experience, along with match scores and location [10, 11].
    • Screening Results: A summary of the candidate’s qualifications and experience relevant to the job [10, 11].
    • Final Recommendations: Recommendations for the candidate to enhance their profile, including developing specific skills or gaining further education [10, 11].

    Key benefits of an AI recruitment system:

    • Efficiency: AI agents can process numerous resumes quickly and efficiently, saving recruiters time.
    • Automation: Many steps of the recruitment process are automated, reducing the need for manual tasks.
    • Cost Reduction: Local LLMs eliminate costs associated with API calls and cloud-based services [3, 5, 12].
    • Customization: The system can be customized to fit specific needs, including using different LLMs or embeddings models [4, 5, 13].
    • Context Maintenance: The system maintains context throughout the process ensuring that each agent has all of the necessary information.
    • Scalability: The system can be easily scaled to handle multiple resumes.

    In conclusion, AI recruitment systems powered by local LLMs and agent frameworks like swarm can streamline the hiring process by automating various tasks, providing comprehensive analysis of candidates, and reducing costs. The flexibility and customization of these systems, combined with the power of LLMs, make them a useful tool for modern recruitment agencies.

    Ollama Course – Build AI Apps Locally

    By Amjad Izhar
    Contact: amjad.izhar@gmail.com
    https://amjadizhar.blog

  • Islamic Law and Family Disputes

    Islamic Law and Family Disputes

    The text presents a discussion on Islamic law and societal norms regarding infertility, adoption, and gender roles. A retired judge and a legal expert debate the complexities of these issues, exploring the lack of legal recourse for women, the societal pressures on barren couples, and the challenges and ambiguities surrounding child adoption within an Islamic framework. The conversation highlights the deep-seated cultural biases against women and the need for legal reforms to address these imbalances. Ultimately, the discussion emphasizes the importance of compassion and fairness in dealing with these sensitive matters.

    Justice and Adoption in Islamic Law

    Answer each question in 2-3 sentences.

    1. According to the speaker, what is the primary cause of tension between men and women in the described context?
    2. What specific societal issue does the speaker highlight as deeply rooted and difficult to eradicate?
    3. What situation involving a young woman and her “class fellow” does the speaker recount as an example of honor killings?
    4. According to the speaker, what support system exists outside of the courts for women in local communities?
    5. What does the speaker suggest about the concept of a man marrying multiple times, and what pre-requisite should be considered?
    6. What issue regarding barren couples does the speaker raise, and what legal form does he think should exist?
    7. What legal barrier exists in the speaker’s country regarding adoption?
    8. What does the speaker suggest is the correct manner of giving assets to an adopted child?
    9. What specific practice of early Islamic law does the speaker cite and discuss in order to make a larger point about the rights and treatment of adopted children?
    10. What message does the speaker wish to convey to the public concerning adoption, particularly in regards to relatives?

    Quiz Answer Key

    1. The speaker attributes the tension between men and women to the belief that men have a right to command and women are meant to serve them. This stems from a deeply ingrained societal concept of male superiority.
    2. The speaker identifies the lack of justice for women as a significant issue. He describes it as “rust” deeply embedded in religion, society, and color, making it difficult to remove.
    3. The speaker recounts an incident where a man killed his sister for being seen with her classmate, emphasizing how easily an alleged offense can escalate to deadly violence in the name of “honor.”
    4. The speaker describes the existence of local councils that provide support to women, thus circumventing the need for women to pursue justice in the courts.
    5. The speaker suggests that if a man wishes to marry multiple wives, he should first seek the permission of his existing wife. This emphasizes that wives deserve consideration and respect.
    6. The speaker raises the issue of barren couples and the desire to have children. He argues there should be a legal process that allows for the creation of family bonds through legal means when biological children cannot be born.
    7. The speaker states that adoption is not legally recognized in his country. This legal barrier creates complications for those who wish to adopt children and provide them with formal familial ties.
    8. The speaker suggests that assets can be gifted during the person’s lifetime to an adopted child, but only up to one-third of the total. The remaining assets would go to a trust or to charity.
    9. The speaker discusses the story of how Prophet Muhammad’s adopted son, Zayd ibn Harithah, was not treated as a biological son under Islamic law, to highlight how deeply entrenched societal views on kinship can impact how we treat adopted children.
    10. The speaker advises against adopting children from close relatives, as it can cause conflict when the biological parents later decide they want their child back. He suggests adopting children that have no family to avoid this particular scenario.

    Essay Questions

    1. Analyze the speaker’s perspective on the societal structures and cultural norms that perpetuate injustice against women. How does the speaker’s argument emphasize the interconnection of cultural norms, religious interpretations, and societal behaviors in shaping gender roles?
    2. Discuss the speaker’s views on adoption in the context of their specific cultural and legal background. How do these views interact with the broader Islamic legal framework, and what alternative solutions does the speaker propose?
    3. Evaluate the speaker’s position on the legal and social status of adopted children. In what ways does he address their vulnerability within the existing system, and how does he suggest they should be treated as a child of the household?
    4. Analyze the connection between the speaker’s concerns about “honor killings” and the overarching theme of injustice in the passage. How does this example relate to the speaker’s broader points about gender roles and the power dynamics within families and society?
    5. Examine the overall message and purpose of the speaker’s statements. Who do they seem to be addressing, and what are they hoping to accomplish by making these points about injustice and social change?

    Glossary of Key Terms

    • Magri Tehzeeb: The speaker refers to this as a Western society. It can be interpreted as a contrast to the speaker’s Islamic society and how it relates to current events.
    • Jagirdars: A system of feudal land ownership, historically in India and Pakistan, where powerful landlords control land and resources, often at the expense of the people working the land.
    • Masalia (Council of): A reference to a local council or community board that operates outside of formal courts to resolve disputes, particularly for women and families.
    • Wuzu: Refers to the ritual ablution, or washing of the hands, arms, face, and feet in preparation for Muslim prayer.
    • Lipat: In this context, the speaker uses lipat to refer to the surface-level appearance of good behavior and morality.
    • Hiba: Refers to a gift or endowment made during one’s lifetime, as contrasted with inheritance after death.
    • Shariat: This refers to the Islamic law derived from the Quran and the teachings of Prophet Muhammad.
    • Jahar Din Haras: Refers to Zayd ibn Harithah, the adopted son of the Prophet Muhammad.
    • Ulema: Islamic scholars or religious leaders who have expertise in Islamic law and theology.
    • Haram: Prohibited or forbidden under Islamic law. In the context of this passage, it refers to the prohibition of adoption.

    Family, Gender, and Adoption in Islam

    Okay, here is a briefing document summarizing the key themes and ideas from the provided text:

    Briefing Document: Analysis of “Pasted Text”

    Date: October 26, 2023

    Subject: Review of Discussions on Family, Gender, and Adoption in an Islamic Context

    Introduction:

    This document analyzes a conversation, likely from a television or radio program, involving Justice Retired Nachana Javed Iqbal Sahib, Afzal Rehan Sahib, and an unnamed female moderator. The discussion revolves around complex issues related to family dynamics, gender roles, women’s rights, adoption, and societal norms within an Islamic framework, primarily in what appears to be a South Asian context.

    Key Themes and Issues:

    1. Gender Inequality and Male Dominance:
    • Entrenched Patriarchy: The conversation highlights a deeply rooted patriarchal system where men feel entitled to command and control women. One participant states, “…the male is found and it is 2 minutes and all the males means however much one understands himself, he has to understand that I am a man and she is a woman and it is my right to command.”
    • Domestic Servitude: There is a perception that a woman’s role is to serve the man, evidenced by the questions, “…is it my hand that should make rotis or pots, is it my hand that should wash my clothes, is it my hand that should spy…?”
    • Lack of Justice for Women: A strong point is made that “in our society there is no justice for women.”
    • Male Accountability for Violence: The speaker notes that in 90% of cases that come before the court, it is the man who is at fault for domestic disputes. This emphasizes a prevalent pattern of male responsibility for marital discord and violence against women.
    • ‘Honor Killings’: The discussion references the issue of “honor killings” and the societal context that can lead to such violence. One tragic example is given of a woman being killed by her brother after he wrongly assumes she was in an inappropriate situation.
    1. Marital Discord and Divorce:
    • Tension due to Infertility: The discussion mentions how childlessness can escalate marital tension, noting that in a specific case, “because of not having children, the tension between them increased even more.”
    • Second Marriages: The conversation touches upon men taking second wives and the need for the first wife’s consent. It is proposed that “if you want to get married then that is over, before that take permission from your wife.”
    • Societal Pressure and Marital Conflict: The negative effects of societal pressures on couples are discussed. A point is made that “if our society is allowed to break the concern for death a little, then many diseases are caused by it, there is blue pressure or there are many other diseases due to it” emphasizing that anxiety and stress about marital issues contribute to poor health.
    1. Adoption and its Complexities:
    • Lack of Legal Recognition: Adoption is noted as not being legally recognized in their country.
    • Inheritance Rights: A major point of concern is regarding the inheritance rights of adopted children, especially since under Islamic law, adopted children are not given the same rights as biological children. The conversation notes “they wanted that you were not their child at all, so can they get a share in the inheritance, can’t they get it, what will he become?”
    • Emotional and Social Challenges: The discussion touches upon the emotional impact on adopted children, noting that it is important to raise them with love. A participant shares, “I have brought it up in such a way that when people say that, oh, this is theirs, you have told me that this is such a human companion that my body is their property.”
    • Importance of a Will: It is stated that “if he does not make a will then he will not get anything.” A recommendation is made that those who adopt can give up to one third of their property to their adopted child.
    • Adopting from Relatives: A warning is given against adopting children from close relatives due to potential future conflicts. “If you want to adopt a child then never adopt a child from your dear relatives whom you are taking from your parents because his parents will also want a child from you some day and you will have to suffer a lot from him.”
    1. The Role of Islamic Teachings & Interpretation:
    • Misinterpretations of Islamic Doctrine: There’s a sense that certain actions and beliefs regarding gender roles are rooted in a misinterpretation of Islamic principles. It is noted that Islam does not teach prejudice based on race and that people should look at principles rather than rigid traditions.
    • Emphasis on Compassion & Justice: The discussion, while complex, attempts to align with principles of Islamic justice, compassion and fair treatment, especially for women and children.
    • Importance of Ijtihad/Independent Reasoning The conversation grapples with modern challenges by utilizing a mix of traditional Islamic teachings and attempting to apply reason to new situations.
    1. Call for Change & Reform:
    • Addressing Root Issues: The speaker laments that the problems of inequality cannot be solved with superficial or cosmetic fixes (“its rust is very deep, it will not go away by giving me and your hunk”).
    • Role of Community Leaders: The discussion also touches on the need for community leaders and councils to actively support women facing domestic abuse and injustices, noting “very good committees have been formed in the council of Masalia, this series has started and this has been happening since 1981.”

    Key Quotes:

    • “in our society there is no justice for women”
    • “the male is found and it is 2 minutes and all the males means however much one understands himself, he has to understand that I am a man and she is a woman and it is my right to command.”
    • “is it my hand that should make rotis or pots, is it my hand that should wash my clothes, is it my hand that should spy…?”
    • “if you want to get married then that is over, before that take permission from your wife.”
    • “If you want to adopt a child then never adopt a child from your dear relatives whom you are taking from your parents because his parents will also want a child from you some day and you will have to suffer a lot from him.”
    • “I have brought it up in such a way that when people say that, oh, this is theirs, you have told me that this is such a human companion that my body is their property.”
    • “its rust is very deep, it will not go away by giving me and your hunk”

    Conclusion:

    The conversation reveals a society grappling with deeply ingrained patriarchal norms, injustices faced by women, and complex issues surrounding adoption within an Islamic context. There is a clear call for reform, for a deeper understanding of Islamic teachings, and for a more just and compassionate society. The discussion highlights a need for legal, social, and emotional support systems, especially for women and adopted children.

    Islamic Law, Family, and Adoption

    FAQ on Islamic Law, Family Dynamics, and Adoption

    1. What are some common issues faced by women within the family structure, as discussed in the text?

    The text highlights several issues women face, including: domestic tension arising from the inability to have children, lack of justice in the patriarchal structure where men often assume a position of dominance and control (including expecting women to do domestic labor and serve them), instances of honor killings (where women are killed for perceived dishonorable actions), and unequal treatment in inheritance matters. The text also points to the lack of social and legal support for women, who are often subject to judgment and scrutiny, even in cases where they are victims of violence or injustice.

    2. The text suggests that “rust” is very deep in society in relation to gender issues. What does this imply and what does it mean for solutions?

    The “rust” refers to deeply ingrained societal attitudes, biases, and traditions that perpetuate inequality and injustice against women. It implies that the problem is not just about individual actions but stems from systematic beliefs and practices related to gender roles that are difficult to change through simple fixes. The speaker says it “will not go away by giving me and your hunk” indicating that simple acts or surface level changes will not solve the deeply ingrained issue. The text suggests that addressing these issues requires comprehensive and prolonged efforts at multiple levels including legal, religious, educational, and social reform, as well as a fundamental shift in societal consciousness.

    3. The text brings up the issue of ‘honor killings’. How does this relate to the broader discussion of women’s rights and societal problems?

    Honor killings, as depicted in the text, are a extreme manifestation of the patriarchal control over women’s lives. The fact that a woman can be killed by her family for perceived transgressions that they deem ‘dishonorable’ highlights the lack of autonomy and safety women often experience. The speaker shares a story of a woman killed by her brother for simply speaking with a male classmate. It underscores the urgent need for changes in societal attitudes and legal systems that protect women from such extreme forms of violence and allows for men to exert control over women.

    4. What is the text’s stance on men’s views of their roles versus women’s roles within families?

    The text criticizes the prevalent patriarchal view that men have an inherent right to command and be served by women, with the expectation that women should be responsible for all domestic labor. The text highlights that such a view is not only unjust, but also harmful to family relationships. The speaker makes a point that some men see their role as the one to perform “wudu” on his own, indicating they believe they can handle more. While it’s not clear what the process of wudu is in the context of this speech, it represents men thinking they have the authority to perform duties that traditionally they may have expected from women. It challenges the perception that women’s roles are confined to domestic duties, emphasizing their need for autonomy, equality, and respect.

    5. How does the text approach the topic of adoption within Islamic contexts, particularly for couples who are unable to conceive?

    The text indicates that while adoption is not formally recognized in some interpretations of Islamic law (and therefore cannot allow someone to become a formal heir), it acknowledges the desire of couples without children to raise and care for children. The text suggests that if a couple adopts a child, that they should treat the child as their own, offer love, and ensure a good upbringing. Further, the text recommends giving a third of what you own to that child as a way of support in their life, rather than as formal inheritance. The text emphasizes the need to love and care for adopted children. It also warns against adopting a child from relatives in order to avoid future conflict. The key message is to ensure an orphaned child receives love and support without creating future difficulties for the adopting family.

    6. What practical advice does the text offer to couples considering adoption?

    The text advises that couples seeking to adopt should first seek other methods of having their own children. Then, if they must adopt, they should avoid taking a child from close relatives, as that can create future problems. It also highlights the importance of loving the adopted child and making sure that they’re well provided for in the home. The text also shares that they can use a third of their finances to support that child after their passing. It also makes clear that when parents adopt, they need to realize they must be prepared to act as if the child was their own and love them accordingly.

    7. What does the text say about the importance of making a will and how it relates to children both biological and adopted?

    The text specifies that while you cannot make a will that favors one biological child over others, there is the possibility of giving up to 1/3 of your money to adopted children. This is permissible in Islamic law. While there is some discussion about how a child will inherit from their parents, it is also made clear that the parents must give to the adopted child if they have that financial capacity. If a will isn’t made, there is discussion as to how that adopted child will be provided for after their parents passing. This is why the text encourages proper documentation of all assets.

    8. What are some of the broader societal issues related to stress, tension and lack of communication highlighted in the text?

    The text links the lack of communication, societal tensions and family issues, to health problems, emphasizing that unresolved conflicts and concerns cause bitterness and distress that manifests as diseases such as high blood pressure. The text calls out that “worry is a disease” and indicates that society would benefit by having difficult discussions and finding solutions to the tensions being discussed. This points to a need for open communication and conflict resolution, especially within the family unit. Ultimately, the text seems to be advocating for more open discussion of difficult topics in order to reach a solution.

    Marital Tensions, Women’s Rights, and Adoption in South Asia

    Okay, here is a timeline of events and a cast of characters based on the provided text. Please note that this is based on a single, rather rambling source, and the events are not presented in a clear chronological order within it. Therefore, the timeline is a reconstruction based on the sequence of discussion within the text.

    Timeline of Main Events and Issues Discussed

    1. Initial Discussion on Marital Tension and Childlessness: The discussion opens with a general concern about tension in marriages, specifically referencing a couple who did not understand each other from the start, exacerbated by their inability to have children. This includes mention of a woman, Ghalib, who had a child by someone outside of her marriage.
    2. Critique of Male Dominance and Justification: A key theme arises, critiquing male dominance and the idea that men have a right to command women, viewing women’s roles as serving them (cooking, cleaning, etc). The speaker notes this is a pervasive idea despite efforts to counter it.
    3. Incidents of Violence Against Women: The text describes several specific incidents:
    • A man who abused and then killed his sister after she was seen talking to a classmate. This is framed within a discussion of “honor killings.”
    • A general mention of countless women being raped due to a “system of jagirdars” (landlords or feudal system)
    1. Discussions on Local Councils and Support for Women: The role of local councils (Masalia) is brought up, suggesting some effort to support women and resolve issues outside of court. These have been happening since 1981. The speaker expresses being happy to be included in those council chair roles.
    2. Polygamy and Wives’ Rights: The issue of men taking multiple wives is discussed, noting that permission should be sought from existing wives, there should be some room for recourse if permission is not granted (for example if a wife will not allow the investigation of a property), and suggesting men should not be allowed to take multiple wives due to a power differential
    3. Adoption and Childlessness: A significant portion of the discussion revolves around adoption, particularly for childless couples. Key points include:
    • The lack of legal recognition of adoption in their society.
    • The complexities of lineage and inheritance related to adopted children.
    • The emotional aspects of adoption, noting the importance of treating an adopted child like one’s own.
    • The need to secure an adopted child’s rights, ideally through gifting (Hiba) in life, not inheritance, or a will limited to one-third of assets.
    1. Inheritance and Wills: Discussion on inheritance laws and whether a parent can give a will to some children but not others
    2. Dangers of Adoption within the Family A suggestion that if you must adopt, do not do so within the family
    3. General societal woes: There are general comments on the dangers of societal stress and how concern, worry, and stress causes many diseases

    Cast of Characters

    • Nachana Javed Iqbal Sahib: A retired Justice. He appears to be a respected figure.
    • Mumtaz Sahib: Mentioned alongside Justice Iqbal, likely a person of some status.
    • Afzal Rehan Sahib: A legal guide and author of the book Islamic Tehzeeb Ka Mubarak Magri Tehzeeb. He appears to be an expert on Islamic and Western societies and their comparison.
    • Ghalib: A woman who had a child outside of her marriage, sparking discussion about infidelity and family tensions.
    • “Bhature President”: (Unnamed) A woman who is an ex-president of “courage” for 12 years and is addressed in the discussion. Her insight is requested based on her experience. This name has a disrespectful tone towards this woman.
    • Sweety: A person whose specific situation leads to discussion about women’s rights. The nature of “Sweety’s condition” is not fully detailed.
    • Adhin: Sweety’s family doctor.
    • The Man Who Killed His Sister: An unnamed man who committed an honor killing. His actions are used as an example of violence against women.
    • The Sister Who Was Killed: An unnamed woman, killed by her brother after being seen speaking to a male classmate.
    • The “Lip-Lock Girl”: An unnamed girl whose existence is seen as the source of contention between a couple. This is a derogatory term used in the text and may not be the girl’s actual name.
    • Rasulallah: The prophet, mentioned as having a son who was not his own.
    • Various unnamed council members Mentioned throughout the text

    Key Themes

    • Women’s Rights and Status: The text is heavily focused on the injustices faced by women within the society. This encompasses physical violence, emotional abuse, and the denial of agency.
    • Male Dominance: The traditional power dynamic between men and women and its effects is a key concern.
    • Marriage, Childlessness, and Adoption: These interlinked issues are a major focus, particularly the legal, emotional, and social implications of adoption in a society where it isn’t recognized legally.
    • Tradition vs. Progress: The text grapples with a tension between tradition and what is considered progress. This is particularly evident in discussions around legal reform, women’s rights, and adoption.
    • Social Woes: There are discussions on how stress, worry, and bitterness contribute to societal problems and diseases

    Let me know if you have any other questions or requests!

    Women’s Justice in Society

    The sources discuss issues related to women’s justice in society, particularly within the context of family, marriage, and societal norms. Here’s a breakdown of the key points:

    • Lack of Justice for Women: One source states that there is a lack of justice for women in society [1]. It is argued that men are conditioned from birth to believe they have the right to command and that women are meant to serve them [1]. This includes expectations that women should perform domestic tasks like cooking and cleaning, and that men have the right to control or “spy” on women [1].
    • Male Dominance and Control: The sources describe a patriarchal system where men believe they have a right to command and women are expected to serve [1]. One source claims that men often think they are superior and have a right to control women [2]. This can lead to situations where men abuse their power, and even resort to violence against women [1, 3].
    • Violence Against Women: The sources describe instances of violence against women, including “honor killings” [1]. One example is given of a man killing his sister because she was talking to a classmate [3]. It’s also noted that in 90% of court cases, men are the perpetrators of violence against women [1]. The “jagirdars” system is mentioned as a factor contributing to the rape of countless women [1].
    • Societal Norms and Expectations: Societal norms and expectations often contribute to the injustices faced by women. For example, there’s a tendency to blame women for problems in relationships [1]. Even in cases where a woman is mistreated, she may be questioned or blamed [1]. A woman who speaks out may be accused of “saying all this to the night” [1].
    • Marriage and Family Dynamics: The sources reveal that tension can arise in marriages, particularly when couples are childless [4]. The issue of a woman having a child with someone other than her husband is also discussed [4]. Additionally, the sources discuss the practice of polygamy, and the need for a man to seek permission from his existing wife before marrying another [5]. In some cases, women may be restricted from even allowing investigation of a husband’s property [5].
    • Adoption and its complexities: Adoption practices are discussed, revealing that adoption is not legally recognized [6]. There are considerations of who can inherit what, and how to handle a child that isn’t biologically one’s own [6, 7]. There’s also mention that if an adopted child is from relatives, there may be issues in the future because the biological parents may want their child back [8].
    • Role of Religious and Cultural Norms: The sources mention religious and cultural aspects that affect women’s rights [1]. There’s a discussion about whether Shariat accepts “dotting” or not [2]. One source mentions that religious and societal rust is very deep, and these issues won’t go away easily [1].

    These points highlight a complex web of societal, cultural, and religious factors that contribute to injustices against women.

    Islamic Adoption: Law, Inheritance, and Social Dynamics

    The sources discuss Islamic adoption practices, highlighting legal and social considerations. Here’s a breakdown:

    • Lack of Legal Recognition: Adoption is not legally recognized [1]. This means that while a child may be taken in and raised by a family, they do not have the same legal rights as biological children, particularly regarding inheritance [1, 2].
    • Inheritance Rights:
    • Adopted Children: An adopted child cannot inherit from their adoptive parents in the same way as a biological child [1].
    • Wills and Bequests: While a will cannot be made in favor of one’s own children [1], up to one-third of one’s property can be bequeathed to an adopted child [2]. The remaining amount would go to the family’s trust, or to charity if there is no trust, as long as the person has made time for the adopted child [2].
    • Hiba: A gift (Hiba) can be given to an adopted child during the adoptive parents’ lifetime [1]. However, it’s suggested that the adoptive parents should retain some of their own property [1].
    • Social and Emotional Considerations:Love and Care: Even if an adopted child does not have the same legal rights, the sources emphasize that they should always be loved [1]. The sources suggest that when a child is adopted, the adoptive parents should consider them as their own child [2].
    • Parental Feelings: It is said that when a child is adopted, the adoptive parents can develop strong feelings of companionship, and consider the child as their own [2]. However, there can be pain if people make comments that highlight that the child is not biological [3].
    • Potential Issues with Relatives: It is advised not to adopt a child from close relatives, as biological parents may want the child back in the future [4]. This could result in difficulties for the adoptive parents [4].
    • Establishing Lineage:The sources note that a child should go to their own parents if they have them [5].
    • If the child doesn’t have parents, adoptive parents may give their “virus” to the child. However, since the child doesn’t have the adopter’s name, it can be difficult to establish a lineage [5].
    • Alternative Approaches:The sources mention that adoption is one way of addressing the desire to raise a child, particularly when there are no biological children [4, 6].
    • There are instances of people adopting children when they cannot have children of their own [6].
    • Medical science is cited as having advanced to help women have children, but if a woman still cannot have children, it is understood that adoption may occur [6].

    In summary, while adoption exists in Islamic society, it differs significantly from legal adoption in many western countries, particularly regarding inheritance rights and legal recognition. The focus is on love, care, and the social and emotional aspects of raising a child, with an emphasis on the challenges and complications that can arise in adoption situations [1, 2].

    Islamic Adoption: Law, Inheritance, and Social Dynamics

    The sources discuss child adoption within an Islamic context, highlighting several key aspects related to legal status, inheritance, and social considerations [1-9].

    • Legal Recognition: Adoption is not legally recognized in the society described by the sources [6]. This means that while a family may take in and raise a child, the child does not have the same legal rights as a biological child, particularly when it comes to inheritance [6, 7].
    • Inheritance Rights:
    • Adopted children cannot inherit from their adoptive parents in the same way as biological children [6].
    • However, up to one-third of one’s property can be bequeathed to an adopted child through a will [7]. The rest of the money would go to the family’s trust or to charity [7].
    • A gift (Hiba) can be given to an adopted child during the adoptive parents’ lifetime [6]. It is also suggested that adoptive parents should retain some of their own property [6].
    • A will cannot be made in favor of one’s own children, so as not to create an injustice to other children [6].
    • Social and Emotional Considerations:
    • Adopted children should always be loved and cared for by their adoptive parents [6].
    • Adoptive parents often develop strong feelings for adopted children, viewing them as their own [7].
    • However, comments from others that highlight that the child is not biological can be hurtful [8].
    • It is advised not to adopt children from close relatives, as their biological parents may want them back [9].
    • There is a desire to raise a child among many couples, and adoption is seen as a way to do this when there are no biological children [4, 9].
    • Establishing Lineage:
    • If the child has parents, the child should go to them [5].
    • If the child does not have parents, adoptive parents may give their “virus” to the child [5]. However, because the child does not have the adopter’s name, this can make it difficult to establish lineage [5].
    • Alternatives:
    • Medical science has advanced to help women have children, but adoption is an option if a woman cannot conceive [4].
    • There are instances of people adopting children when they cannot have children of their own [4, 9].
    • The sources mention that if a couple adopts a child, they should consider them as their own child [7].
    • Other Considerations:
    • If someone is going to adopt, they should think carefully before doing so and if they do, to do so with proof [6].
    • If an orphan is adopted, there should be careful consideration of whether to do so [6].
    • There are concerns about the future of the child if the adoptive parents do not have their own children [6, 8].
    • It’s important to understand that a child adopted will not have the same attachment to the adoptive family as a biological child [6].

    In summary, the sources outline a system of adoption that exists in the Islamic society described. The focus is on the emotional and social bonds formed, rather than the legal aspects, as the legal system does not recognize adoption, particularly in terms of inheritance. While there are practices to provide for the child, the adopted child does not have the same rights as a biological child.

    Family Disputes and Societal Norms

    Family disputes are a recurring theme in the sources, arising from various issues including marital tension, childlessness, adoption, and differing views on gender roles and rights. Here’s a breakdown of the different types of family disputes discussed in the sources:

    • Marital Tension and Childlessness: The sources indicate that tension can arise within a marriage, particularly when a couple is unable to have children [1]. This lack of children can exacerbate existing issues between spouses. Additionally, disputes may arise when a woman has a child with someone other than her husband [1].
    • Polygamy and Spousal Conflict: The practice of a man taking multiple wives is discussed, and the sources indicate that this can lead to conflict and tension [2]. A man is supposed to seek permission from his current wife before marrying another [2]. Disputes can arise if a wife does not want her husband to take another wife, or if the man does so without permission [2].
    • Gender Roles and Male Dominance: The sources reveal that disputes often stem from differing views on gender roles and rights [3, 4]. Men may believe they have the right to command and control women, while women are expected to be subservient [3]. This can lead to conflict when women do not conform to these expectations [3]. There can be disputes about domestic duties, such as who should cook or clean, and whether men have the right to monitor or “spy” on women [3].
    • Violence and “Honor Killings”: The sources describe how disputes can escalate to violence, including “honor killings” [3, 5]. One example is given of a man killing his sister because she was talking to a male classmate [5]. The sources reveal that in the majority of court cases, men are the perpetrators of violence against women [3].
    • Adoption and Inheritance Issues: Disputes can arise in the context of adoption, particularly when it comes to inheritance rights [6, 7]. Because adoption is not legally recognized, adopted children do not have the same inheritance rights as biological children [6]. This can lead to disputes among family members about who is entitled to what [6]. There can be disputes about who should care for and raise a child, especially if the biological parents of an adopted child want their child back [8]. Also, the sources say that there can be issues when people make comments about an adopted child not being biologically related to the family [9].
    • Disputes over Lineage: If a couple adopts a child, but does not have any biological children, there can be disputes over who the adopted child’s family is [4]. The sources note that a child should go to their own parents, if they have them [4].
    • Societal and Cultural Pressures: The sources note that family disputes are often exacerbated by broader societal and cultural norms [3, 9]. There is a tendency to blame women for problems in relationships, or for not conforming to traditional expectations [3].
    • Role of Extended Family: The sources mention that extended family can also play a role in disputes, especially when they try to interfere in the lives of married couples [6, 9]. For example, the mother of a spouse may become involved in a dispute [4].
    • Divorce: The sources also mention that some family disputes can lead to divorce [8]. There are concerns about the increase in the rate of divorce [8]. It is mentioned that many illnesses can be caused by stress related to family disputes, and those issues can lead to divorce [8].

    In summary, the sources present family disputes as a complex issue stemming from marital problems, gender inequality, violence, and differing perspectives on adoption and inheritance, exacerbated by societal norms and cultural expectations.

    Family Law in an Islamic Society

    The sources discuss various legal issues, primarily within the context of family and personal law, particularly concerning marriage, divorce, adoption, and inheritance. Here’s a breakdown of the legal issues discussed:

    • Adoption and Legal Recognition:
    • Adoption is not legally recognized [1]. This means that while a child can be taken in and raised by a family, the child doesn’t have the same legal rights as a biological child, particularly when it comes to inheritance [1].
    • The lack of legal recognition for adoption creates challenges regarding the child’s rights and status within the family and society [1].
    • Inheritance Laws:
    • Adopted children cannot inherit from their adoptive parents in the same way as biological children [1].
    • A will cannot be made in favor of one’s own children [1]. This is to ensure that all children are treated fairly [1].
    • However, up to one-third of one’s property can be bequeathed to an adopted child through a will [2]. The rest of the money would go to the family’s trust or to charity [2].
    • A gift (Hiba) can be given to an adopted child during the adoptive parents’ lifetime [1]. It is also suggested that adoptive parents should retain some of their own property [1].
    • If a person does not make a will, the adopted child will not get anything [2].
    • Marriage and Polygamy:
    • The sources suggest that a man is supposed to seek permission from his current wife before marrying another [3].
    • There is some scope that a man can marry another woman if his current wife does not give too much resistance. A man may make an application to the chairman if his wife does not allow him to marry another woman [3].
    • The sources indicate that taking multiple wives can lead to conflict and tension within the family [3].
    • Divorce:
    • The sources mention the increasing rate of divorce and the societal problems that can lead to divorce [4].
    • There are concerns that stress related to family disputes can cause illnesses and contribute to divorce [4].
    • Gender Roles and Rights:
    • The sources reveal a patriarchal societal structure where men are often seen as having the right to command and control women [5, 6].
    • There are disputes over domestic duties [5, 6].
    • The sources reveal that in the majority of court cases, men are the perpetrators of violence against women [5].
    • The sources discuss issues of women’s rights and justice within the society, and there are concerns that the legal system is not always fair to women [5].
    • “Honor Killings”:
    • The sources discuss the issue of “honor killings” and other forms of violence against women [5, 7].
    • One example of a man killing his sister because she was talking to a male classmate is mentioned, which highlights the extreme consequences of these cultural norms [5, 7].
    • Family Courts and Councils:
    • The sources mention the existence of councils and committees, which suggests an alternative means of resolving disputes outside of formal court systems [7].
    • These councils can provide support to women and families within their own locality, offering an alternative to going through the court system [7].
    • Child Custody:
    • The sources note that if a child has their own parents, the child should go to them [6].
    • In adoption cases, there can be disputes over who should care for and raise a child, especially if the biological parents want their child back [4].
    • If a child is adopted by a couple, and the couple has no children of their own, there can be disputes about who the child’s family is [6].
    • Property Rights:
    • The sources mention that if a man wants to marry again, his wife may want to ensure her property rights are protected [3].
    • There is the implication that men are often landlords with control over property [3].

    In summary, the sources reveal a complex legal landscape that reflects the societal and cultural norms of the described Islamic society. While there are formal legal structures, the discussions suggest that customary practices, cultural traditions, and religious interpretations heavily influence how legal issues are handled, particularly within family law.

    By Amjad Izhar
    Contact: amjad.izhar@gmail.com
    https://amjadizhar.blog